Creating a Hierarchical Data Table with Indented Groups
This example produces a report that indents the data based on
its hierarchical grouping and features two levels of grouping. Once again,
the first step is to understand the data and what groupings are required.
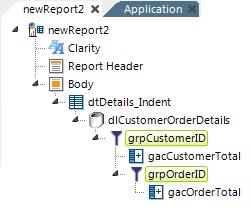
The example above shows a report definition in which a SQL query has been
used to retrieve data from a JOIN of the Customer, Orders, OrderDetails,
and Products tables. The query includes a calculated column created by
multiplying UnitPrice by Quantity to get an
UnitTotal value. Here's the T-SQL query used in the example:
Select Orders.OrderID, Orders.CustomerID, Orders.OrderDate, [Order
Details].UnitPrice,
[Order Details].Quantity, [Order Details].UnitPrice *
[Order Details].Quantity AS UnitTotal,
Customers.CompanyName, Products.ProductID
From Orders
Inner Join [Order Details] On Orders.OrderID = [Order
Details].OrderID
Inner Join Customers On Customers.CustomerID =
Orders.CustomerID
Inner Join Products On Products.ProductID = [Order
Details].ProductID
A Group Filter element is used to create a grouping of the data by CustomerID and to create a group aggregate column that sums the UnitTotal values for each customer. Then a second, nested Group Filter is used to group and calculate a sum for each order, again using UnitTotal values. Once again, we need to give both Group Filter elements a unique ID, which we'll use later, and we want to keep all of their grouped rows, by setting their Keep Grouped Rows attribute values to True.
![]() Because the second Group Aggregate Column element is nested,
gacOrderTotal will not appear in Logi Studio's drop-down lists of
attribute options or Intelligent Token Completion feature. You'll need to
enter it manually.
Because the second Group Aggregate Column element is nested,
gacOrderTotal will not appear in Logi Studio's drop-down lists of
attribute options or Intelligent Token Completion feature. You'll need to
enter it manually.
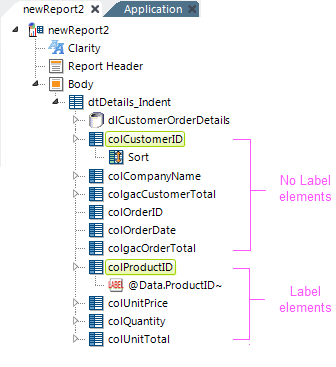
The next step, as shown above, is to provide columns for the data by adding Data Table Column elements to the definition. The first six of these columns will be "placeholders" - we won't be putting Label element in them to show data. Their data will be displayed using a different mechanism described later. They can, optionally, have child Sort elements.
For the last four Data Table columns, colProduct ID though colUnitTotal, we will add a Label element, with an @Data token in its Caption attribute, to display their data.
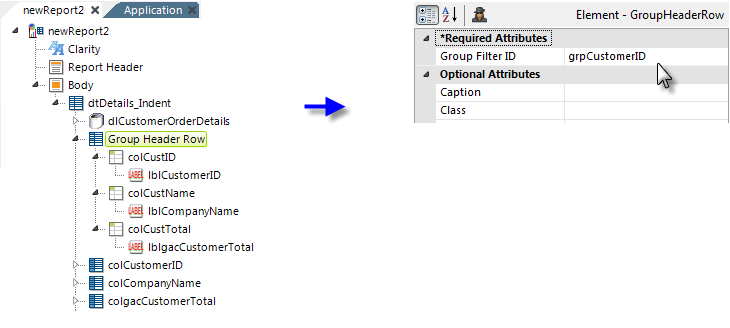
To provide data at the Customer level, a Group Header Row element is used, as shown above. Its Group Filter ID attribute value is set to the ID of the relevant group filter ("grpCustomer"). Beneath the header row, Column Cell and Label elements are added to provide the data in the first three columns of the report.
The actual location of the Group Header Row element in the element tree -
at the top as shown or after its placeholder column elements - doesn't
matter.
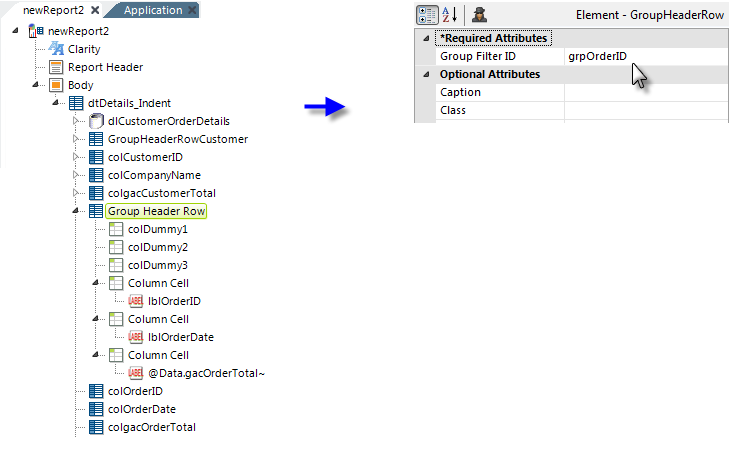
The process is repeated for the Order data, by adding another Group Header Row element, as shown above. However, this time three "dummy" Column Cell elements must be added to account for the columns holding the Customer-level data. Then three Column Cells are added to contain the Order-level data.
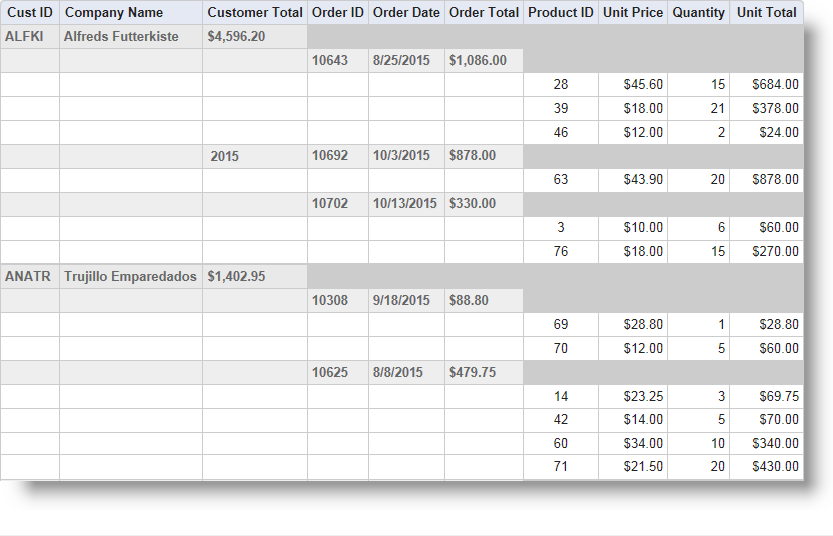
The resulting report looks like the example above. You can see that each level of grouping - Company, Order, and Product - has a different indentation level.
Group Summary Row elements could be used instead of, or in addition to, Group Header Rows in order to place the summarized Order data beneath the Order Details.