Zoom Control
The Chart Canvas element's Series child elements cause a data visualization (the chart) to be rendered in the canvas. The Zoom Control element is available as a child of Chart Canvas and allows the user to "zoom" into the canvas, magnifying a portion of it.
This topic contains the following sections:
- About the Zoom Control
- Attributes
About the Zoom Control
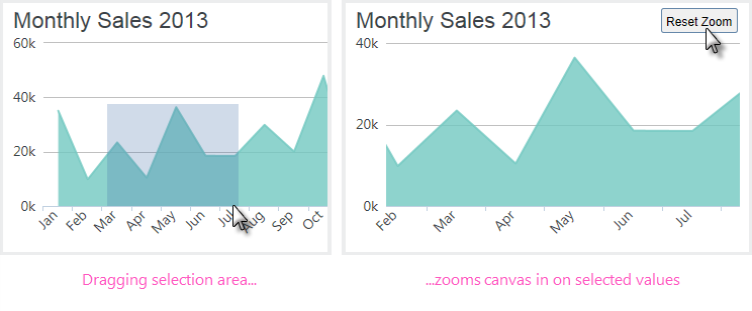
The Zoom Control element imparts a magnification feature to Chart Canvas.

As shown above, at runtime users can use the mouse to draw a selection area on the canvas and the canvas will be"zoomed in" on the selected data. A "Reset Zoom" button is also displayed, which will return the canvas to its original magnification.
The Reset Zoom button only appears when the mouse cursor is hovered over the upper right-hand corner of the chart.
The appearance of the Reset Zoom button can be styled using the Reset Zoom Button and Reset Zoom Button Hover Style child elements.
![]() The Zoom Control is not available for Series.Funnel, Series.Pie, or Series.Pyramid.
The Zoom Control is not available for Series.Funnel, Series.Pie, or Series.Pyramid.
Attributes
The Zoom Control element has the following attributes:
| Attribute | Description |
|---|---|
| Selection Area Color | Specifies the color of the selection area on the chart.
|
| Selection Area Color Transparency | Specifies the transparency of the Selection Area Color. The lowest value of 0 specifies that the point fill is opaque, with no transparency. At the other end of the scale, a value of 15 specifies a completely transparent fill. |
| Zoom Control Type | Specifies the nature of the selection area that can be drawn. Options include: Area (the default) - allows dragging the mouse in any direction to draw the selection area. AreaXAxis - dragging can only be done along the X-axis. AreaYAxis - dragging can only be done along the Y-axis. |
