Working with Gauges
Static gauges provide a variety of interesting visualizations that can be almost photographic in their appearance. Gauges are SVG images that can be exported and scaled smoothly (they can have a child Resizer element).
Many gauges can be exported as a .PNG image, including the following:
- Gauge.Arc
- Gauge.Angular
- Gauge.Balloon Bar
- Gauge.Bullet Bar
- Gauge.Number
More information about how to configure them to be exportable can be found in Export Chart Canvas Charts.
Needle Gauges
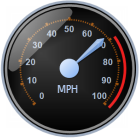
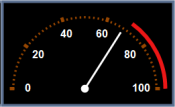
Needle gauges look like speedometers: they have a needle pointer that swings through an arc and indicates a data value on a scale. Gauge shapes include half-round, quarter-round, and rectangular.
The Gauge.Needle element has been deprecated, you should use Gauge.Angular instead.
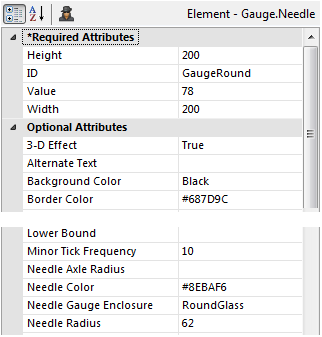
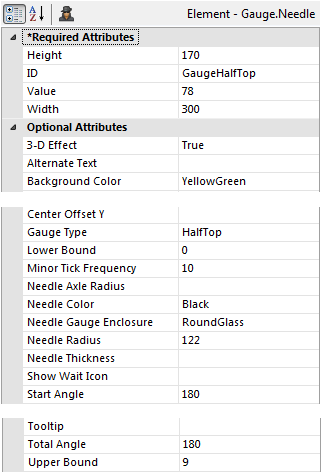
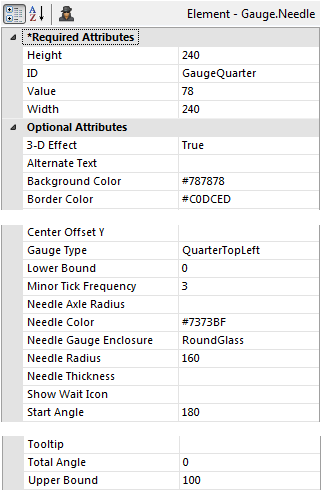
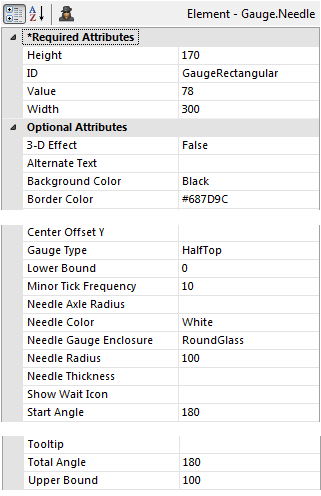
The Start Angle and Total Angle attributes of the Gauge.Needle element govern the possible positions of the needle pointer. Here's a table of examples, showing some of the possible shapes and configurations:
| Gauge Type | Configuration | Notes |
|---|---|---|
Round Gauge
|
| Start Angle value minimum = 0 |
Half-Round Gauge
|
| HalfTop (shown) HalfBottom |
Quarter-Round Gauge
|
| QuarterTopLeft (shown) QuarterTopRight QuarterBottomRight QuarterBottomLeft |
Rectangular Gauge
|
| Type is set to HalfTop. |
Arc Gauges
Arc gauges are simple, clean visualizations which show beginning and ending values, with an arched color bar between them. The data value number is shown inside the arc.
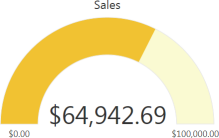
The gauge may have multiple ranges in different colors. The color of the arc is determined by which range contains the value.
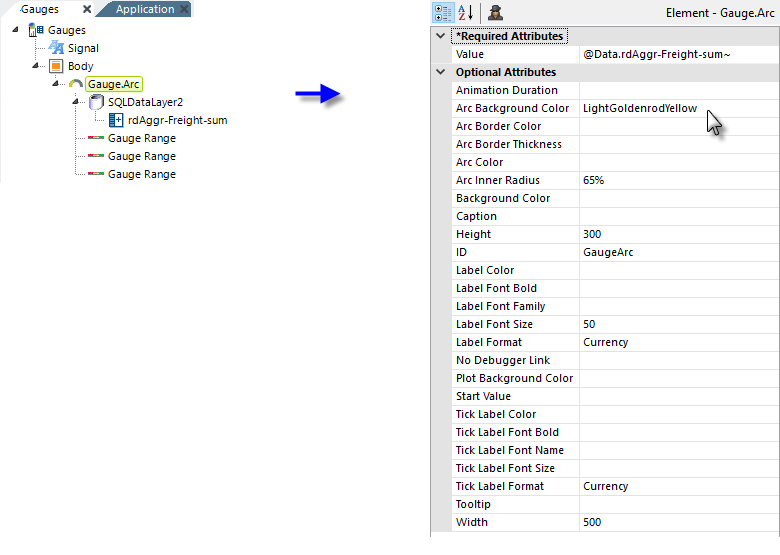
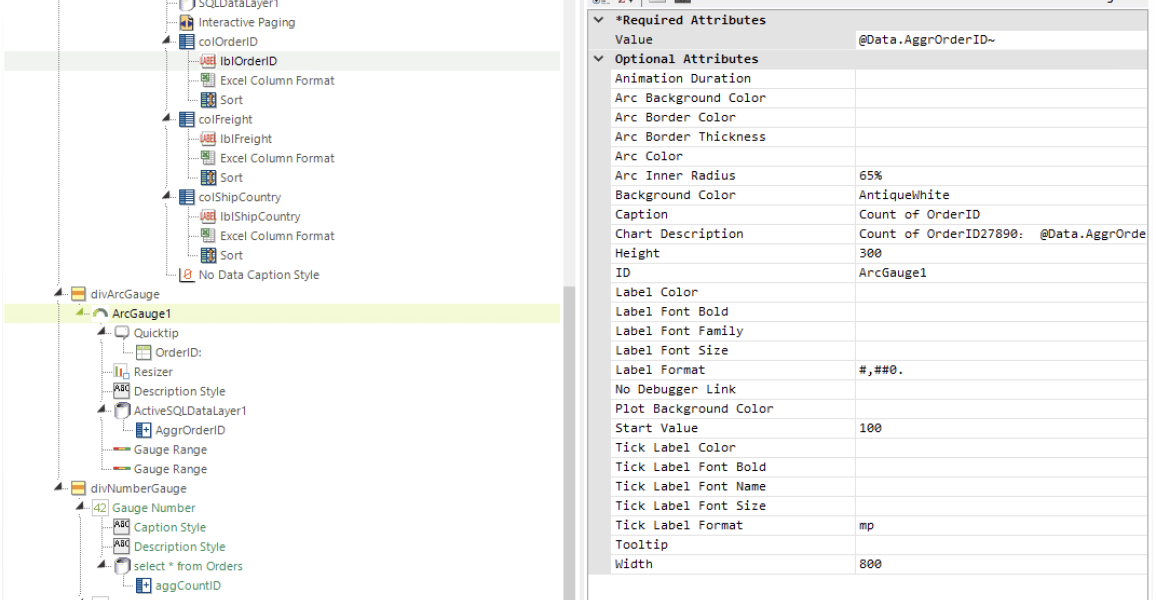
The example shows how the Gauge.Arc element is configured and its child Gauge Range elements, which give the arc different colors for specific data values.
The No Debugger Link attribute can be used to suppress individual chart/gauge debug icons that appear when debugging is turned on. You may want to do this to reduce "visual clutter" and ensure a realistic layout when debugging a page that includes relatively small charts and gauges.
