 New for 14.1Gradient Style
The Chart Canvas element's Gradient Style child element enables you to customize your visualization with gradient fills.

When adding the Gradient Style element to your chart, you have the option between Linear Gradient and Radial Gradient style. Some gradients may work better than others, depending on the chart type.
This topic discusses the following types of gradients:
Linear Gradient
The Linear Gradient style can be used to represent two or more colors along a straight line. This style is best used with Line, Bar, Bubble, and Area charts.
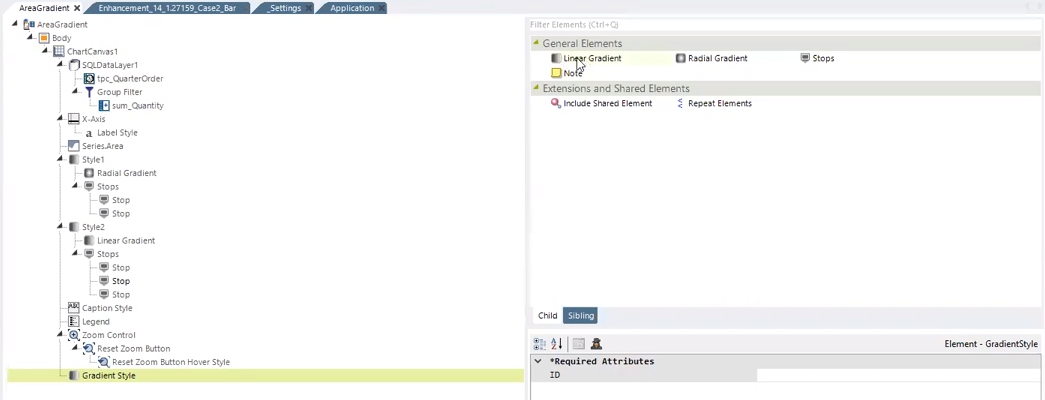
To utilize this feature add the Gradient Style element to your chart:

Choose the Linear Gradient element:

Next, enter values between 0-1 (1=100, .5=50%) for the required attributes x1, x2, y1, and y2. These values act as intercepts to calculate the distance between the coordinates in your chart. Note that the 'x1' and 'y1' attributes are both reflective of the starting point, while 'x2' and 'y2' are both reflective of the gradient's end point.

For reference, the chart below represents the coordinates that are allocated using x1, y1, x2, and y2:

Once you've entered the required attributes, add the @Chart token to the chart's Color attribute and choose the Style you want to reference.

Lastly, specify how many stops you want to appear on the chart and use the Stop Flag attribute to set the gradient fill number from 0-1 (1=100, .5=50%) to separate the stops.

In the example below, the Linear Gradient's stops are denoted in green, yellow, and red.

![]() The chart's legend is indicative of the style, color, and fill of the gradient.
The chart's legend is indicative of the style, color, and fill of the gradient.
You can add as many styles as you want under the Chart Canvas. Using these styles, you can add the gradient fill and color to Legend, Zoom Control, and other elements in your Chart Canvas.
Linear Gradient Attributes
The Linear Gradient element has the following attributes:
| Attribute | Description |
|---|---|
| x1 | Sets the x coordinate of the first point. Enter a value between 0-100 (1=100%, .5=50%). |
| x2 | Sets the x coordinate of the end point. Enter a value between 0-100 (1=100%, .5=50%). |
| y1 | Sets the y coordinate of the first point. Enter a value between 0-100 (1=100%, .5=50%). |
| y2 | Sets the y coordinate of the end point. Enter a value between 0-100 (1=100%, .5=50%). |
Radial Gradient
The Radial Gradient style can be used to represent two or more colors that radiate from an origin. This style is best used with Pie or Polar chart.
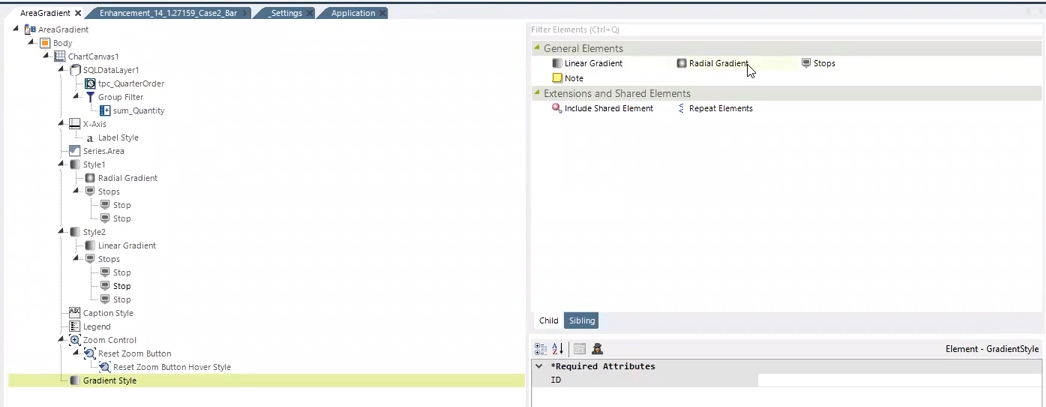
To utilize this feature add the Gradient Style element to your chart:

Choose the Radial Gradient element:

Next, enter values between 0-1 (1=100, .5=50%) for the required attributes cx, cy, and r. These values act as intercepts to calculate the distance between the coordinates in your chart. Note that when the 'r' attribute is set to 1, the gradient covers the entire circle.

Once you've entered the required attributes, add the @Chart token to the chart's Color attribute and choose the Style you want to reference.

Lastly, specify how many stops you want to appear on the chart and use the Stop Flag attribute to set the gradient fill number from 0-1 (1=100, .5=50%) to separate the stops.

In the example below, the Radial Gradient's stops are denoted in green and yellow.

![]() The chart's legend is indicative of the style, color, and fill of the gradient.
The chart's legend is indicative of the style, color, and fill of the gradient.
You can add as many styles as you want under the Chart Canvas. Using these styles, you can add the gradient fill and color to Legend, Zoom Control, and other elements in your Chart Canvas.
Radial Gradient Attributes
The Radial Gradient element has the following attributes:
| Attribute | Description |
|---|---|
| cx | Sets the x coordinate for the circle. Enter a value between 0-100 (1=100%, .5=50%). |
| cy | Sets the y coordinate for the circle. Enter a value between 0-100 (1=100%, .5=50%). |
| r | Sets the radius of the circle. Enter a value between 0-100 (1=100%, the gradient will cover the entire circle). |