Adding a Simple ArcGIS Map
The following assumes an existing Logi application, with a report definition ready to have ArcGIS maps added to it.
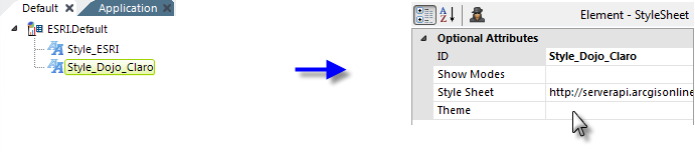
We'll begin by adding two Style elements to your report definition, as shown above, and configuring them to access style sheets available from ArcGIS, using API v3.4. The style sheet URLs are:
- http://serverapi.arcgisonline.com/jsapi/arcgis/3.4/js/esri/css/esri.css
http://serverapi.arcgisonline.com/jsapi/arcgis/3.4/js/dojo/dijit/themes/claro/claro.css
The second style sheet is for one of four Dojo Dijit themes available: claro, tundra, soria and nihilo. Feel free to try out different themes.
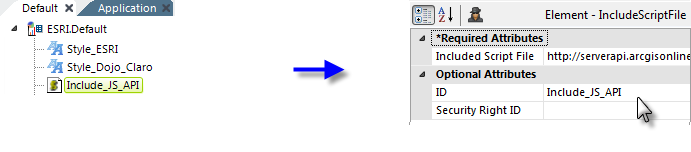
Next, we need to include the ArcGIS API library, using an Include Script File element, as shown above. The complete URL for the v3.4 API is:
- http://serverapi.arcgisonline.com/jsapi/arcgis/3.4/
 This URL doesn't include a filename with a .js extension as you might expect.
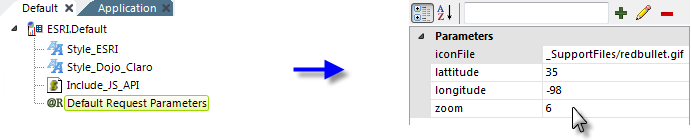
Next, we add a Default Request Parameters element to provide some default values to control the initial map appearance and specify the icon image that will be used to pinpoint locations on the map. The names of the parameters are arbitrary and will be used later in our JavaScript code.
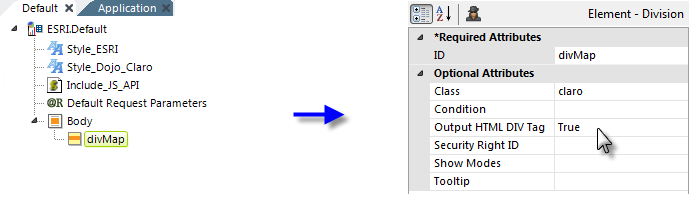
Now, we add a Division element, as shown above, which will be the ArcGIS map container. Its attributes are set to give it a unique ID, to set its Class to one from the Dojo themes, and to ensure that it's rendered as a DIV tag. You can control the size of the map by using CSS to set the height and width of this container element.
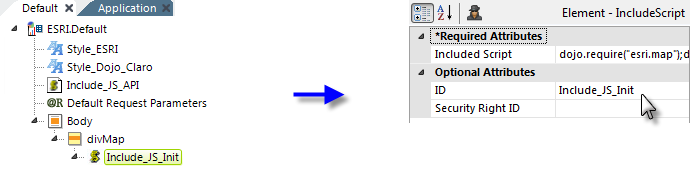
Next, we add an Include Script element with JavaScript code, using the API, to create and initialize the map. Here's that code:
dojo.require("esri.map");
dojo.require("esri.dijit.Popup");
var map;
function init() {
map = new esri.Map("divMap",{
basemap: "topo",
center: [ @Request.longitude~ , @Request.lattitude~ ], //longitude, latitude
zoom: @Request.zoom~,
infoWindow: new esri.dijit.Popup(null, dojo.create("div"))
});
}
dojo.ready(init);
Note these items in the code:
- The "divMap" identifier of our map container Division element is used in the Map constructor.
- The API offers several basemap types, including: topo, streets, satellite, hybrid, national-geographic, and more.
- @Request tokens, for the default request parameters, are used to center the map and set its initial zoom factor.
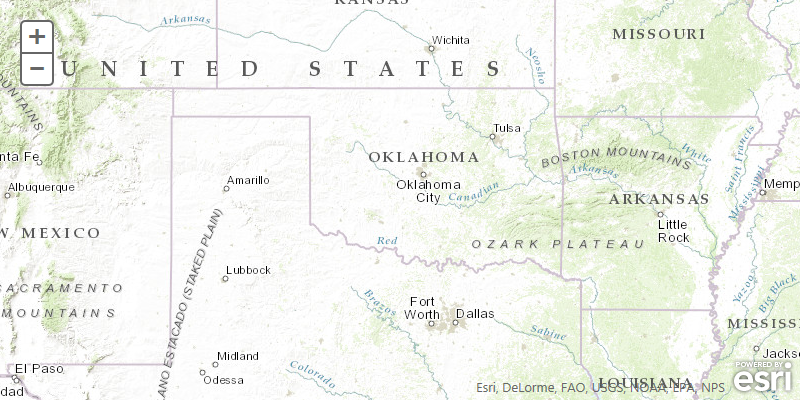
If we preview the definition, we'll see the map shown above. The zoom controls and ESRI logo can be controlled using different API options.
Now let's add some data-driven points to the map:
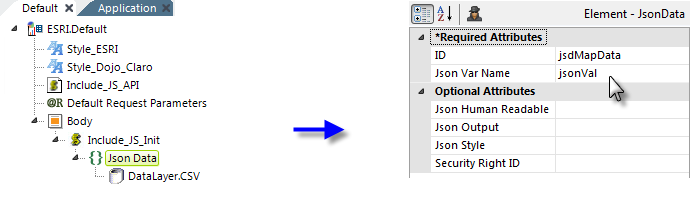
In this example, we'll access data in a .csv data file using Json Data and DataLayer.CSV elements, as shown above. The .csv file data looks like this:
dataTitle,dataDescription,latitude,longitude
Nichols Hills Wellhead,Details of <a href=http://devnet.logianalytics.com>Well #1</a>,35.534741,-97.528243
Del City Wellhead,Details of <a href=http://www.logianalytics.com>Well #2</a>,35.434741,-97.428243
Draper Lake Wellhead,Details of <a href=http://www.google.com/#q=Logi+Analytics>Well #3</a>,35.334741,-97.328243
The first row in the .csv file provides the data column names we'll use in our code. Notice that HTML is included right in the data, to provide links. We could, of course, get the data from any of the many other datasources supported by Logi Info.
In order to use the JSON data retrieved from the file, we need to add some new JavaScript code in our Include Script element, as follows:
dojo.require("esri.map");
dojo.require("esri.dijit.Popup");
var map;
function init() {
map = new esri.Map("divMap",{
basemap: "topo",
center: [ @Request.longitude~ , @Request.lattitude~ ], //longitude, latitude
zoom: @Request.zoom~,
infoWindow: new esri.dijit.Popup(null, dojo.create("div"))
});
dojo.connect(map,"onLoad", addWells);
}
function addWells(data){
var symbol = new esri.symbol.PictureMarkerSymbol("@Request.iconFile~", 24, 24);
var template = new esri.dijit.PopupTemplate({
title: "{dataTitle}",
description:"{dataDescription}"
});
for (var w in jsonVal) {
var loc = new esri.geometry.Point(jsonVal[w].longitude, jsonVal[w].latitude);
map.graphics.add(new esri.Graphic(loc, symbol, jsonVal[w], template));
}
}
dojo.ready(init);
New code is shown above with a white background. Note these items in the code:
- The @Request token for the default request parameter for the map marker icon image is used.
- Data column names "dataTitle" and "dataDescription" are used to insert the data where needed for the pop-up that appears when a map marker is clicked.
- Latitude and longitude data for positioning the map markers is inserted using the array of values, jsonVal, identified in the Json Data element.
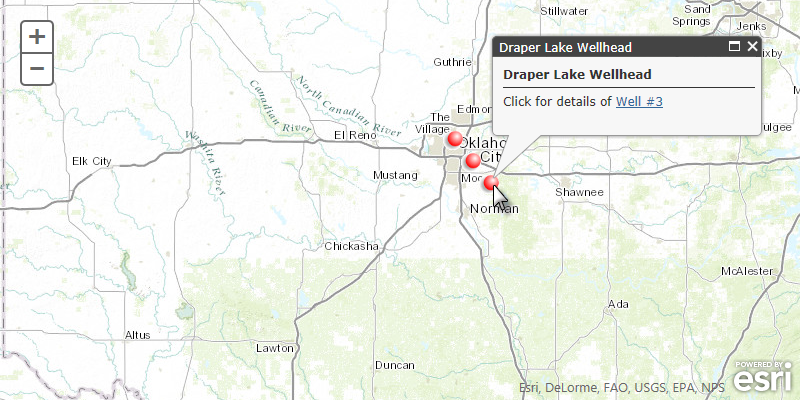 Now when the map is displayed (and we zoom in a couple of clicks), the three map markers from our data file appear. If a marker is clicked, as shown above, a pop-up panel provides the data for that location. You may need to drag the map southward to see the complete pop-up panel. The pop-up panel can be styled and customized using the API.