Group Drillthrough
The Chart Canvas element's Group Drillthrough child element adds grouped data point links which, when clicked, display a basic drill-through report showing the detail data used to create the group.
The following topics discuss the Group Drillthrough child element:
About Group Drillthrough
Data is often grouped, especially when it's related to time, to show an aggregated view of it. "Sales by Month" is an example where the data for each month is aggregated by month. It's often useful to be able to quickly examine the data in the aggregation and the Group Drillthrough element provides this feature for Chart Canvas charts.
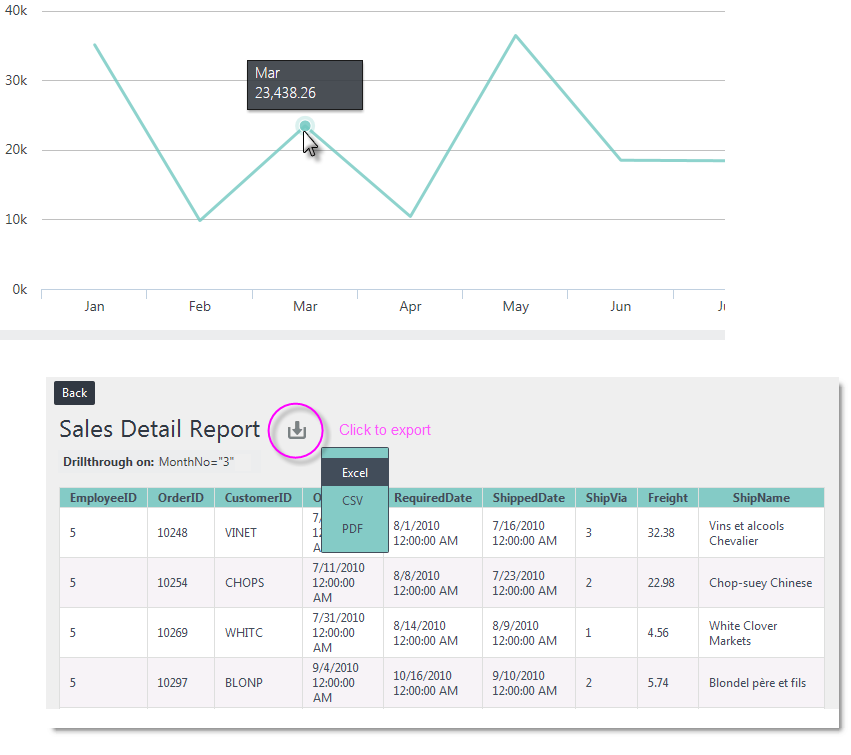
In the example shown above, a line chart visualizes data that's been grouped by month. When the March data point is clicked, the detail report is displayed. It contains all of the grouped data in a data table. The detail report format and styling shown are the defaults, using the stock Signal theme.
The Group Drillthrough element can be used as a child of the Chart Canvas element, or as the child of individual Series elements.