Logi XOLAP - The Dimension Grid
The Dimension Grid is a super-element that provides a complete user
interface for data analysis using Logi XOLAP cubes:

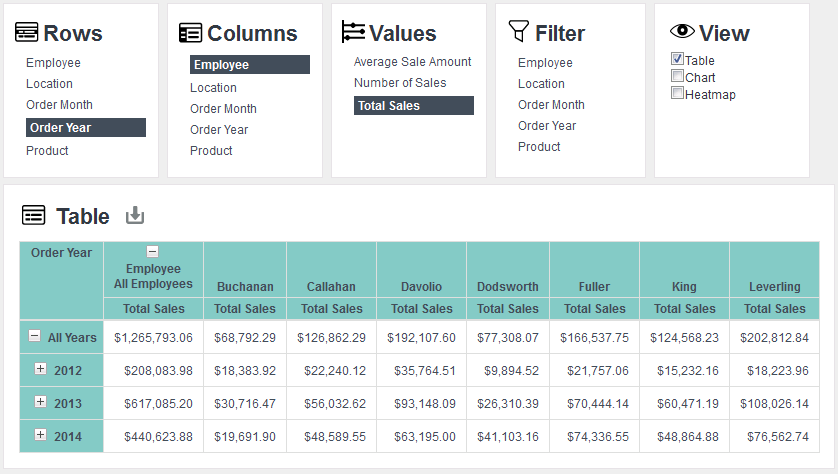
As shown above, the Dimension Grid consists of panels across the top and the data table. Charts and a Heatmap can be displayed beneath the table as well. Users can dynamically change the contents of the data table or charts at runtime using the controls in the panels (subject to the way the report developer has configured the grid). Users, through their browsers, can slice-and-dice and drill into the XOLAP data at runtime to perform the analyses they need.
The appearance of the Dimension Grid can be controlled using Logi Themes and custom CSS. For example, the grid shown above uses the Signal Theme. Its functionality can also be customized on a per-user basis and the changes users make at runtime can be saved between sessions and restored for their next session.
The Dimension Grid and the XOLAP-family of elements that support it are described in detail in Dimension Grid.