Series.Area - Using the Quicktips Element
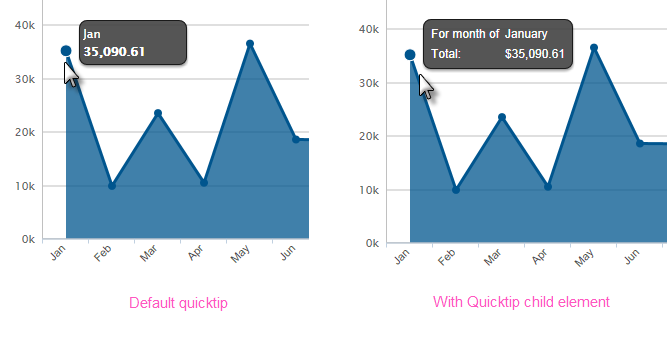
By default, a "quicktip" is displayed when the mouse hovers near or over a data point:

The automatically-generated quicktip displays information for the X- and Y-axis, as shown above, left. However, you may want to display other information or format it differently, perhaps as shown above, right, which can be done by adding a Quicktip child element beneath Series.Area and setting its attributes and child elements. Use @Chart tokens to include chart data in the quicktip.
Intrinsic functions are supported in the Quicktip attributes.
You can deliberately add additional lines by adding child Quicktip Row elements beneath the Quicktip, one for each additional line of text you want to include.
![]() The Quicktip Row element has been made context-sensitive with the addition of a Condition attribute.
The Quicktip Row element has been made context-sensitive with the addition of a Condition attribute.