Analysis Filter - Using Analysis Filters in Dashboards
Analysis Filters can be used to filter data for visualizations in Dashboards, in individual panels and globally.
Panels derived from an Analysis Grid having an Active Query Builder child element can have the Analysis Filter automatically generated. This enables the user to filter data for panels created from a metadata-driven Analysis Grid, without the need
to
add the
Analysis Filter elements described below. This is controlled by the Dashboard element'sAuto Panel Filters attribute.
Filtering Individual Panels
As you might expect, the data used in a dashboard panel can be filtered with an Analysis Filter.
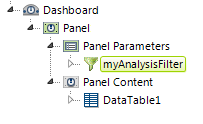
As shown above, implementing Analysis Filters in a panel is simple. In the dashboard panel, add a Panel Parameters element with a child Analysis Filter element. Configure the Analysis Filter, and its child elements. Don't forget to add an Analysis Filter Insert element beneath your datalayer.
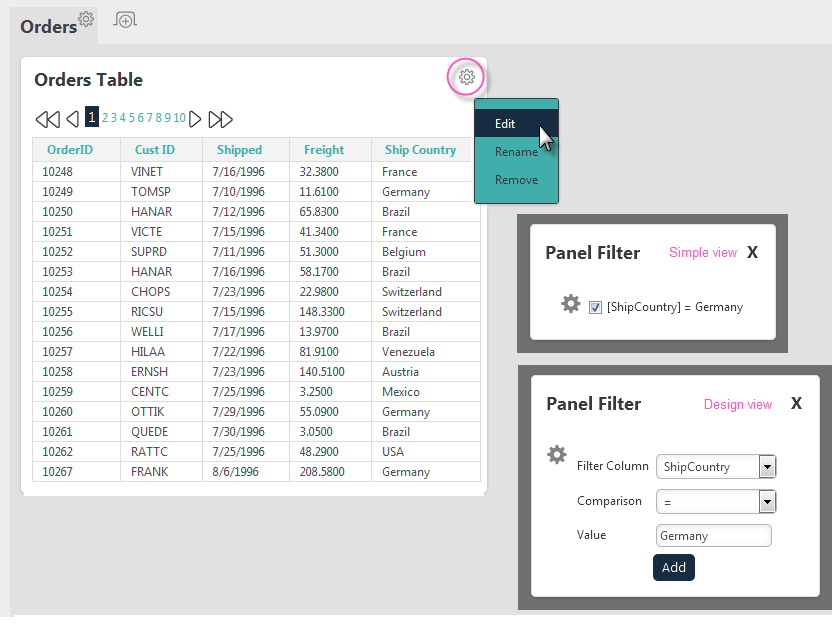
Once the Analysis Filter has been added, clicking the panel's "gear" icon will display a menu that has an "Edit" option. This option will open the Panel Filter panel, as shown above. The controls displayed in it will depend on the view mode, Simple or Design, configured in the Analysis Filter attributes and have been discussed earlier in this topic.
Adding or removing filters will immediately filter the data in the dashboard panel accordingly.
Adding a Global Filter
You can also add a "global" filter, one that affects the data used in multiple dashboard panels at once. This type of filter functionality is automatically available when there are multiple dashboard panels containing Analysis Filter elements, or multiple panels created from a metadata-driven Analysis Grid, and is controlled by the Dashboard element's Auto Global Filter attribute.
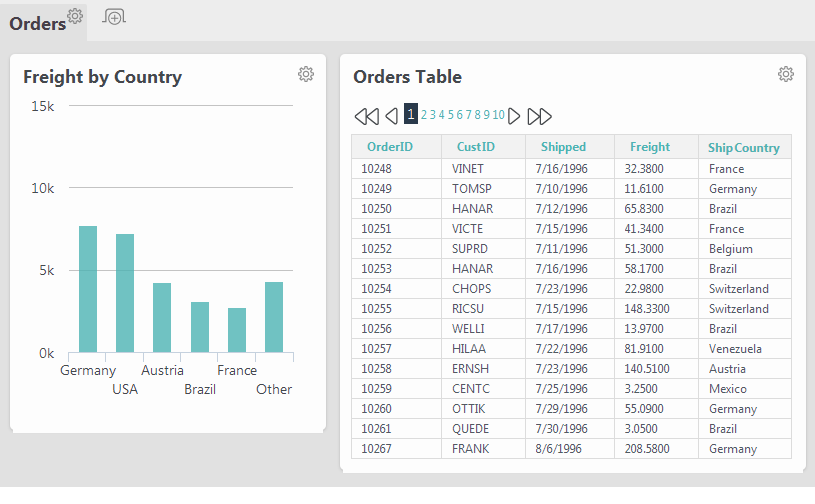
The example dashboard shown above has two panels, each of which has an Analysis Filter configured for it. Both visualizations use data from the ShipCountry column in their datalayers.
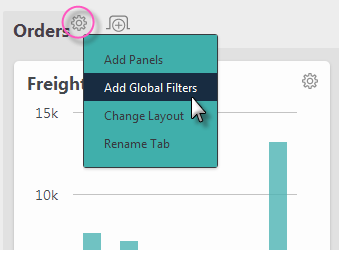
We can create a global filter by clicking the gear icon for the dashboard tab, as shown above, and selecting the Add Global Filters pop-up menu item.
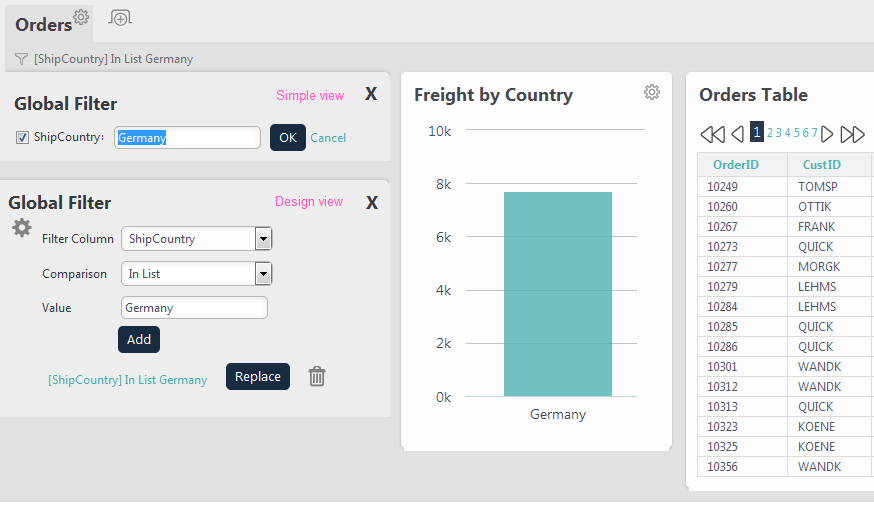
The Global Filter panel will be displayed, as shown above. The controls displayed in it will depend on the configured view mode and have been discussed earlier in this topic. Adding a global filter will immediately update the data in both dashboard panels.
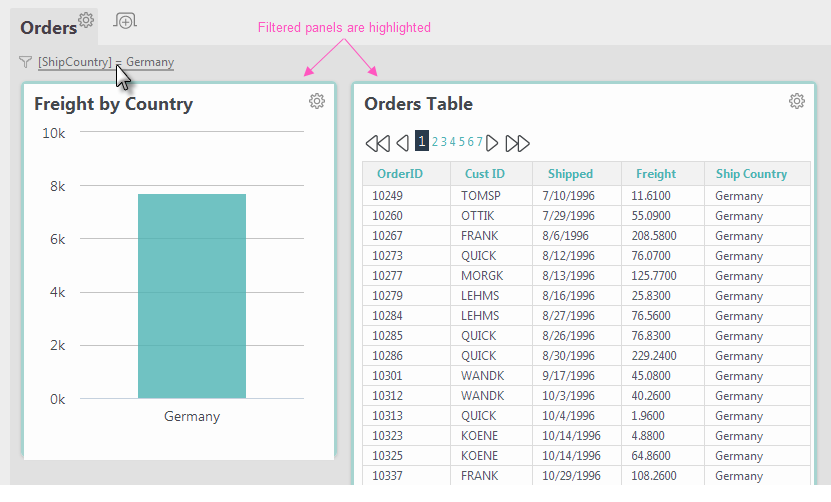
A global filter description will appear at the top of the tab and can be used as a link to re-open the Global Filter panel.
In addition, when you hover your mouse cursor over this description, the panels affected by the global filter will be highlighted, as shown above.
If you uncheck all of the defined filters in Simple view and close the panel, no descriptions are shown but the Filter icon will remain and you can click it to re-open the panel.
Global Filtering using Chart Data Points
You can also create a global filter in a dashboard by selecting data points in a chart. This is behavior similar to that seen when you use Chart Canvas chart and Input Selection elements together. Let's see it in action:
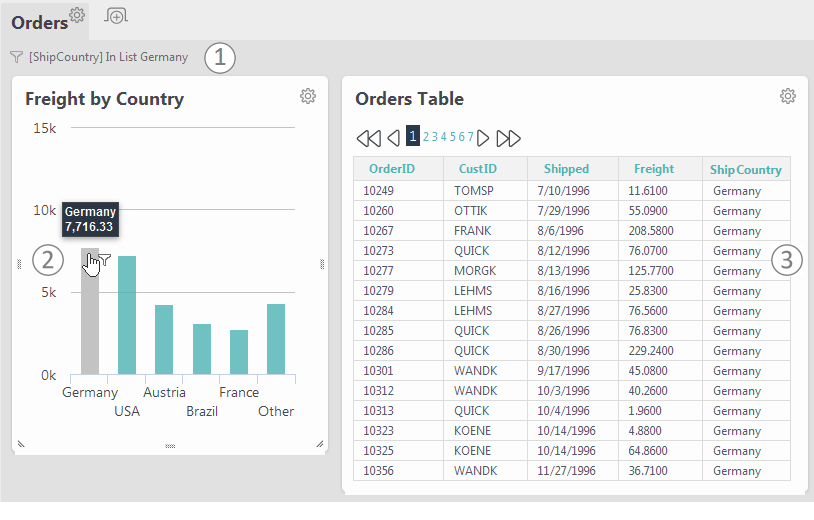
Once again, we have an example with two dashboard panels, one with a chart and one with a table, shown above. When a bar in the chart is clicked, a global filter is created automatically and three other things happen:
- A Filter Description appears at the top of the dashboard tab. This can be clicked to edit the global filter.
- The color of the selected chart bar changes to indicate it's included in a filter.
- The data for the table in the second panel is filtered.
![]() This is different from the previous global filtering example because the chart that was clicked is not filtered.
This is different from the previous global filtering example because the chart that was clicked is not filtered.
Clicking the same chart bar a second time will cancel the filter related to that data. Clicking another bar will add additional criteria to the global filter.
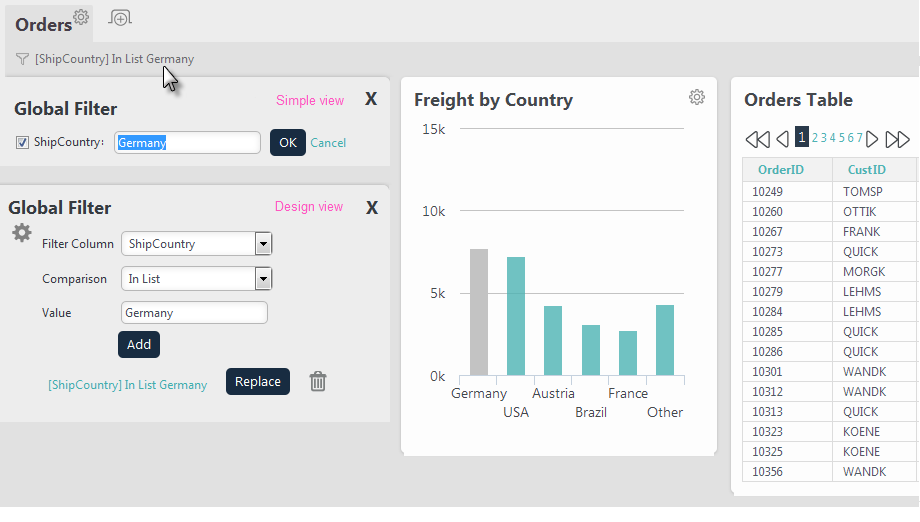
Clicking the Filter Description at the top of the dashboard tab will cause the automatically-generated Global Filter panel to be displayed. As before, the controls displayed in it will depend on the view mode, Simple or Design, configured in the Analysis Filter attributes.
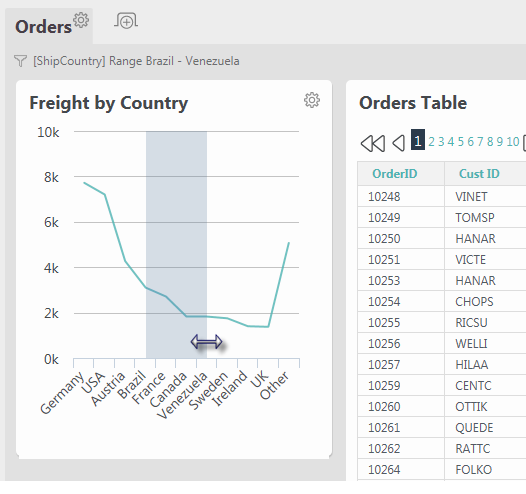
For chart types that support it, you can also create a global filter by dragging the cursor to select a range of values, as shown in the Line chart above. This is similar to using Chart Canvas chart and Input Selection Range elements.
More information about dashboards can be found in Dashboard for End Users.