Conditional Formatting
Conditional formatting is very useful when you want to highlight significant data values in a report.
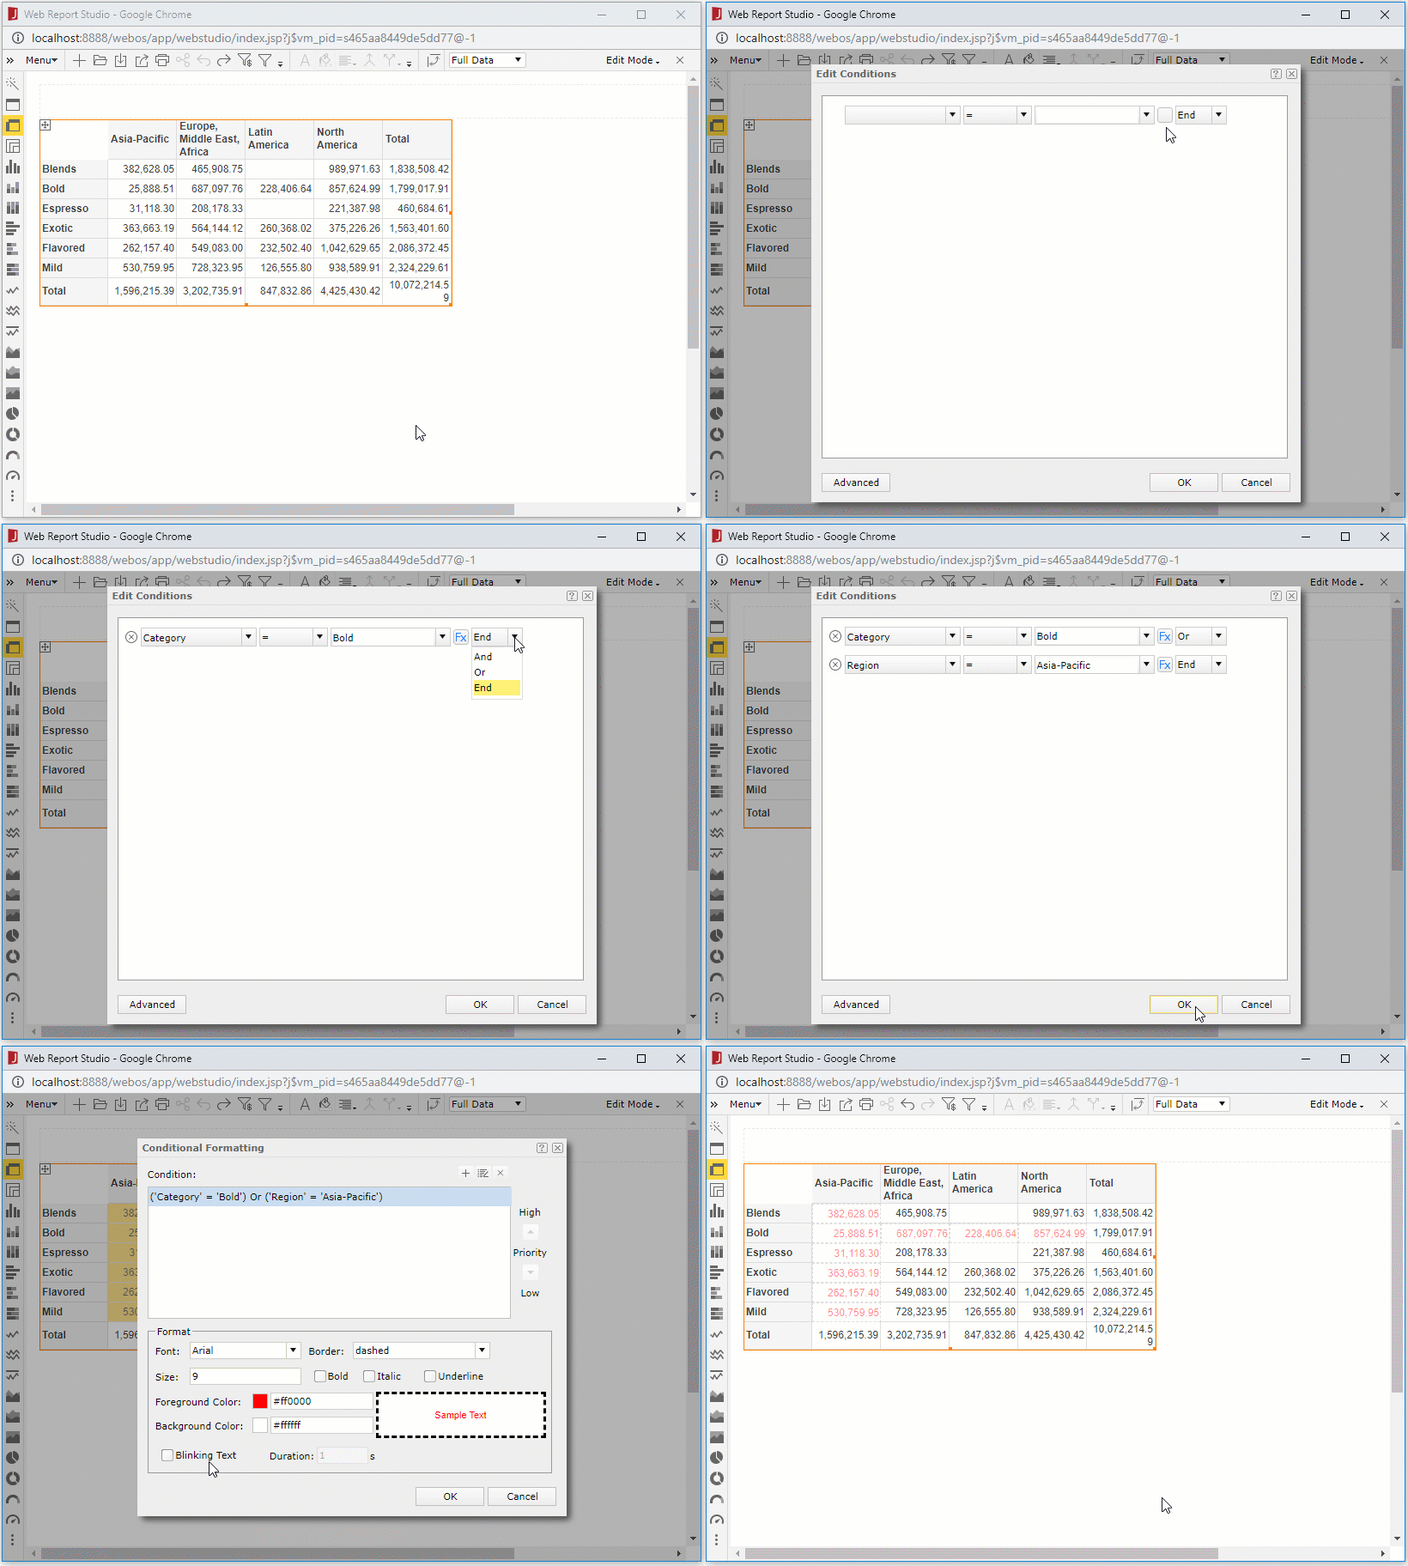
Conditional Formatting in Tables/Crosstabs/Banded Objects
Different conditional formats can be added to the data fields in a table, crosstab or banded object, then when a specified condition is fulfilled, the format bound with the condition will be applied to the field values automatically.
Conditional formatting in tables, crosstabs and banded objects are supported both at report design time and server runtime.

Conditional Formatting in Charts
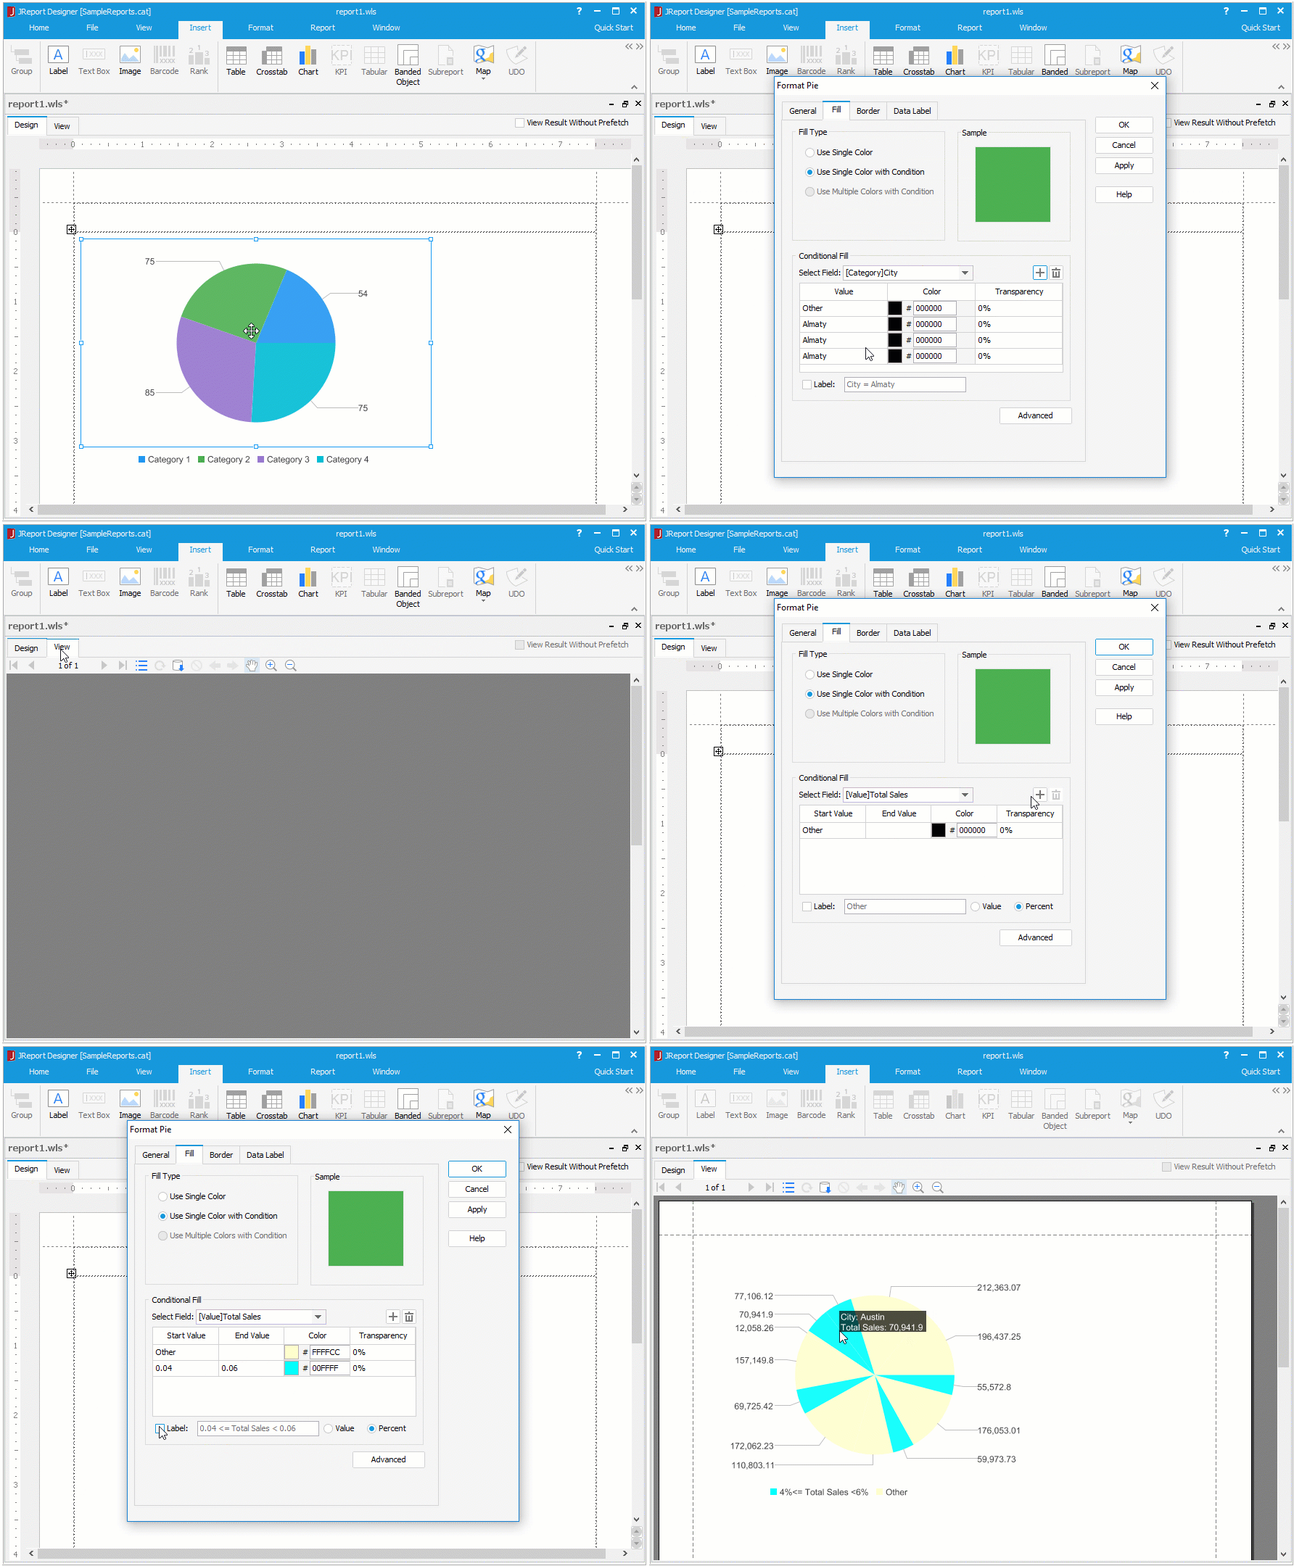
Different color patterns can be applied to the data markers of a chart based on different value ranges. Currently the feature is supported on bar, bench, pie, donut, area (Area 2-D and Area 3-D types), 2-D line and heat map charts at report design time only.
There are two types of conditional formatting for charts: Single Color with Condition and Multiple Colors with Condition. With a single color, you can make the data marker that meets the specified condition apply the color pattern bound with the condition. By using multiple colors, you can divide each data marker into different parts based on different value ranges along the direction of the value axis, and then specify different conditional colors to different value ranges.
The following example uses Single Color with Condition.


