Applying Filters in Web Report
You can apply filters to business views and data components such as tables, crosstabs, charts, banded objects, and KPIs in a web report to narrow down the data in the web report. This topic describes how you can apply filters in web reports.
This topic contains the following sections:
- Applying Filters to the Business Views for Data Components
- Filtering the Data Components in a Report
- Managing On-Screen Filters
Applying Filters to the Business Views for Data Components
When creating a web report, you can apply filters to the specified business view to narrow down the data scope of the data component that uses the business view. Filters for business views are defined into two categories in Logi Report: predefined filters and user defined filters. As the name suggests, predefined filters are defined in advance when creating or editing the business views using Logi Report Designer, and user defined filters are created on the business views while they are used.
You can define business view filters on the component level in Web Report Studio. Each time you create a data component, you can apply a filter to the business view it uses without affecting other data components based on the same business view.
To apply a filter to the business view a data component uses:
- Do any of the following to open the Query Filter dialog box:
- Select Menu > Edit > Query Filter.
- Select the Query Filter button
 on the toolbar.
 - Right-click a data component and select Query Filter from the shortcut menu.
- For a table, chart, crosstab, or banded object, while creating or editing it with the report wizard, select the Filter button next to the Data Source drop-down list.
- If you accessed the dialog box from the menu or toolbar, select a data component from the Apply To drop-down list to filter the business view it uses.
- Specify the filter to apply to the business view.
Server lists all the predefined filters of the business view that the specified data component uses, in the Query Filter drop-down list. Choose the one you want to apply. If you want to further edit the filter, select the Edit button and then redefine the filter. Server saves the edited filter as a user defined filter to the business view.
If you prefer to define a filter on your own, select User Defined from the Query Filter drop-down list, then define the filter according to your requirements.
The dialog box has the basic and advanced modes for you to define a filter using either simple expressions or complex expressions.
- To define a filter using simple expressions:
- Make sure the dialog box is in the basic mode.
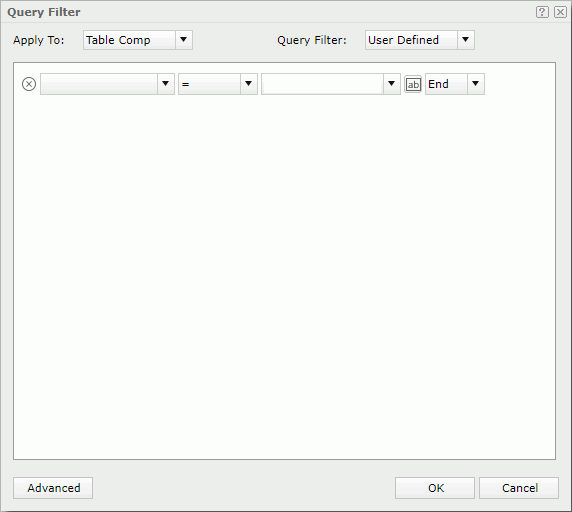
- Select the field on which the filter will be based from the field drop-down list.
- From the operator drop-down list, select the operator with which to compose the filter expression.
- Type the values of how to filter the field in the value text box, or select one or more values from the drop-down list. When you type multiple values manually, you should separate them with ",", and if "," or "\" is contained in the values, write it as "\," or "\\".
To specify an empty string as the value for a field of String type, simply leave the text box blank (value length=0).
You can also select the button
 and then select a parameter from the drop-down list to specify the value dynamically. When the available parameters cannot meet your requirement, you can create a local parameter to use in the filter.
 - If you want to add another condition line, from the logic operator drop-down list,
- To add a condition line of the AND relationship with the current line, select And, then define the expression as required.
- To add a condition line of the OR relationship with the current line, select Or, then define the expression as required.
You can repeat this to add more condition lines. To delete a condition line, select the delete button
 on its left.
- Make sure the dialog box is in the basic mode.
- To define a filter using complex expressions:
- Select Advanced to switch the dialog box to the advanced mode.
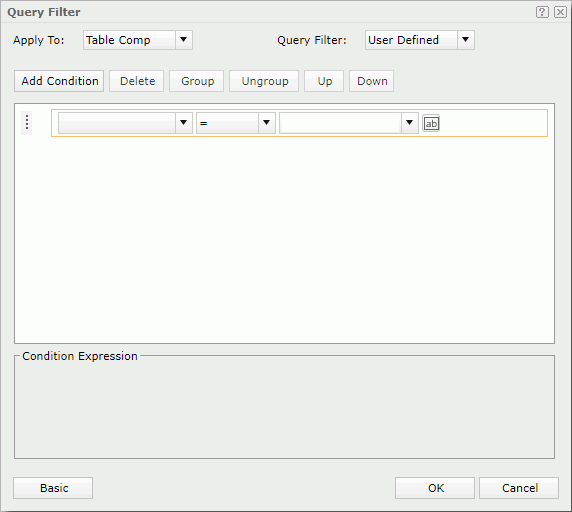
- Select Add Condition to add a condition line.
- From the field drop-down list, select the field on which the filter will be based.
- From the operator drop-down list, select the operator with which to compose the filter expression.
- Type the values of how to filter the field in the value text box, or select one or more values from the drop-down list. When you type multiple values manually, you should separate them with ",", and if "," or "\" is contained in the values, write it as "\," or "\\".
To specify an empty string as the value for a field of String type, simply leave the text box blank (value length=0).
You can also select the button
 and then select a parameter from the drop-down list to specify the value dynamically. When the available parameters cannot meet your requirement, you can create a local parameter to use in the filter.
 - To add another condition line, select Add Condition and define the expression.
- Select the logic button until you get the required logic to specify the relationship between the two filter expressions. The logic can be AND, OR, AND NOT, or OR NOT.
- You can repeat the above steps to add more condition lines.
- To group some conditions, select them and then select Group. Server adds the selected conditions in one group and they work as one line of filter expression. You can further group conditions and groups together.
- To take any condition or group in a group out, select it and then select Ungroup. It is the equivalent of adding parenthesis in a logic expression.
- To adjust the priority of a condition line or a group, select it and select Up or Down.
- To delete a condition line or a group, select it and then select Delete.
- Select Advanced to switch the dialog box to the advanced mode.
Tip: When the dialog box is in the basic mode and you select a predefined filter from the Query Filter drop-down list which is a complex one, Server switches the dialog box to the advanced mode automatically.
- To define a filter using simple expressions:
- Select OK to apply the filter. If you opened the Query Filter dialog box from the report wizard, Server applies the specified filter to the business view after you finish the wizard.
If the filter conditions use parameters, Server lists the parameters in the Parameters panel. You can then specify the parameter values in the panel to dynamically define the filter conditions.
Filtering the Data Components in a Report
To filter the data components in a web report, you can take any of the following ways: use the Filter dialog box, use the Filter panel, or use filter controls. For tables, you can also filter them via shortcut menu, column headers or labels, and for banded objects, via shortcut menu and labels.
Using the Filter Dialog
When using the Filter dialog box to filter report data, you can only apply the filter to a specific data component in the current web report.
- Select Menu > Edit > Filter, or the Filter button
 on the toolbar. Server displays the Filter dialog box.
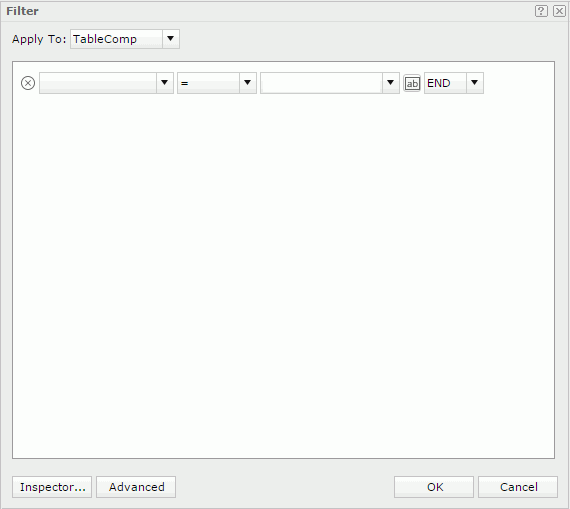
- From the Apply To drop-down list, select the data component in the report to which you want to apply the filter.
Tip: For web reports that you created in Logi Report Designer, the default selected data component and available data components in the Apply To drop-down list are determined by the Default for Filter and Invisible for Filter Dialogs properties of the components.
- Define the filter using either simple expressions or complex expressions.
- Select OK to apply the filter. If the filter conditions use parameters, Server lists the parameters in the Parameters panel and you can specify the parameter values in the panel to dynamically define the filter conditions.
The Filter dialog box provides an entry to all the filters that the current web report uses. You can select the Inspector button to view more filter information in the Filter Inspector dialog box.
Using the Filter Panel
The Filter panel on the left of Web Report Studio filters data components in the current report. You can create in the panel as many filters as you want which resemble filter controls.
The filters that you created via the Filter panel are referred to as on-screen filters, the values of which you can save as the default ones.
To use the Filter panel:
- Select the add button + on the title bar of the panel. Server displays the Select Field dialog box.
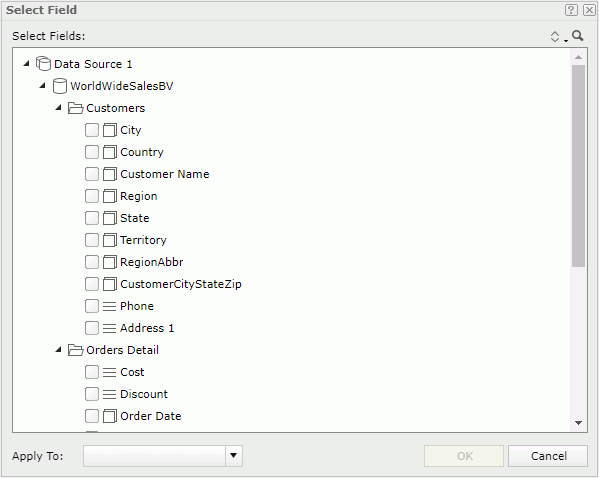
- The Select Fields box lists all the group and detail objects in the business views that the current report uses. Select the objects of the same data type based on which to create the filter.
- From the Apply To drop-down list, select the data components in the report to apply the filter to.
By default, Web Report Studio applies the filter to all the data components created using the business views that contains the selected objects. If you do not select the data components which are based on the same business view as any selected objects, Serer does not add those objects with their values in the filter when it adds the filter in the Filter panel.
- Select OK. Server adds a filter box in the Filter panel. If the objects bound to the filter box have the same values, the values are distinctive in the filter box.
- Select the values with which you want to filter the report data. Server applies a filter condition based on the selected values to the specified data components in the report.
You can make use of the Ctrl or Shift key to select multiple values. If the values themselves have inter-relationship, after you make the selection, Server deals with the rest values to put the related ones on the top and gray the ones that have no relationship with the selected values. The grayed values are still selectable.
The following section describes more about the Filter panel:
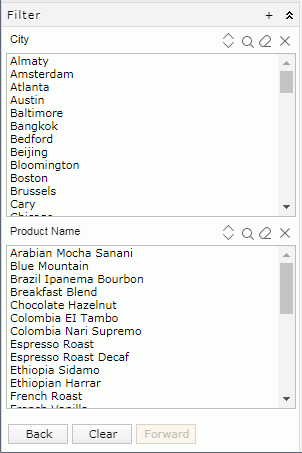
You can use the buttons on the bottom of the Filter panel to deal with the value selection in the panel.
- Back
Select to go back to the previous value selection status and refresh the report data accordingly. - Clear
Select to remove all the value selection histories and all the filter conditions based on the selections, and refresh the report data accordingly. - Forward
Select to go forward to the next value selection status and refresh the report data accordingly.
For each filter in the panel, you can manage it with the buttons on its title bar or the shortcut menu as follows:
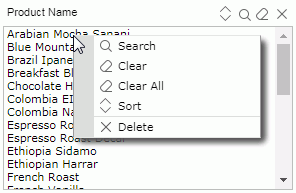
- Search

Select to open the search bar right above the value list for searching the desired values. For more information, see the Select Values dialog box. - Clear

Select to cancel the selection of values in the current filter box. - Clear All
Select to cancel the selection of all values in the Filter panel. - Sort

Select to sort the values in the ascending or descending order. - Delete

Select to remove the filter from the Filter panel and remove the corresponding filter conditions from the report too.
![]()
- Server removes the values in the filter box when you remove the data components that use the same business view as the involved objects of these values.
- When there are more than 300 values for an object, Web Report Studio uses Big Data Loading logic. In this case, the Shift Key for multiple selection does not work.
- You cannot see the filter conditions created via the Filter panel when you open web reports in Logi Report Designer.
- If you delete all the data components in a report that use a business view, Server removes the objects in the business view from the Filter panel too.
Using the Shortcut Menu
For tables and banded objects, you can use the filter-related commands on the shortcut menu to filter the data. To do this, point to any value of a detail field by which you want to filter data, then right-click to show the shortcut menu. You will see the Filter item has a submenu containing the following commands:
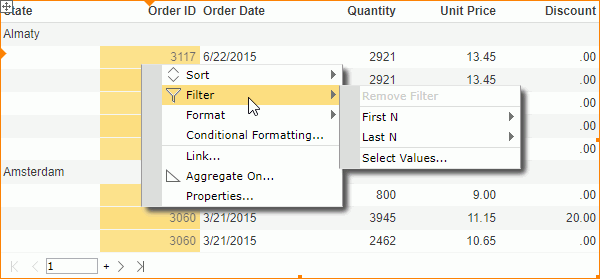
- Remove Filter
Server enables this command after you have applied filter on the field. You can select it to remove the filter from the field. - First N
It filters the field to display only its first N values. You can select a number from the submenu or type a positive integer into the text box on the submenu to specify the number. - Last N
It filters the field to display only its last N values. You can select a number from the submenu or type a positive integer into the text box on the submenu to specify the number. - Select Values
Select this item and Server displays the Select Values dialog box for you to select the values to filter the field with.
Using Column Headers
You can use the filter button on any table column header to filter values in the column. Before you do this, you need to enable the feature in the server profile first.
- In the Common tab of the My Profile > Customize Profile page or Administration > Server Profile > Customize Profile page, select the option Filter on Column Headers.
- Select Show Sort/Filter Status on Column Headers if you want the filter buttons to display on the table column headers after you apply filter conditions to the columns. Select OK to save the profile setting.
- Run a web report that contains a table in Web Report Studio.
- Put the mouse pointer on any column header and you can see the filter button
 .
.
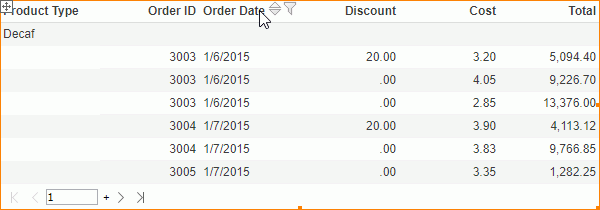
- Select the filter button
 . Server displays a filter list which contains the same items as the Filter submenu.
 - Select the required item to filter the column. Server highlights the filter button in the column.
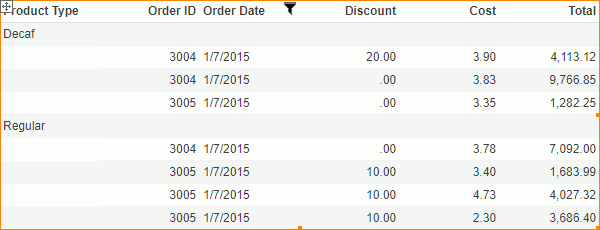
![]() You cannot filter a summary column that contains multiple aggregation objects, via its column header.
You cannot filter a summary column that contains multiple aggregation objects, via its column header.
Using Labels
With Logi Report Designer, you can bind a label in a table/banded object with a field in the table/banded object, to enable filtering on the label, by setting the label's Bind Column and Filterable properties. Then when running the table/banded object in Web Report Studio, you can select the filter button beside the label to filter values of the bound field. This functions the same as via the table column headers.
When a label is bound with a field, if you also enabled the Filter on Column Header feature in the server profile, the former has higher priority. For example, if you bind the label in column A header with the field in column B, when you select the filter button on column A header, Server filters the values in column B.
Tip: After filtering the data in a table or banded object by either shortcut menu, column header, or label, you may notice the corresponding filter expression in the Filter dialog box.
Managing On-Screen Filters
Filters that you created via the Filter panel and filter controls in a web report are called on-screen filters. Web Report Studio enables you to save values for them as the default values.
Saving and Using Default On-Screen Filter Values
When you enabled the Use Default On-screen Filter Values feature for web reports in the server profile, you can save the values that you specified to the on-screen filters as the default values for the report and for yourself. Then the next time when you run the report, Server applies the saved values to the on-screen filters by default. The default on-screen filter values work on a user-report basis.
- To save values that you specified to the on-screen filters in a report as the default values, select Menu > Edit > On-screen Filter Values and then select Save as Default.
- To clear the default values that you have saved to the on-screen filters in a report, select Menu > Edit > On-screen Filter Values and then select Clear Default.
- To replace the values that you specified for the on-screen filters in a report with the saved default values, select Menu > Edit > On-screen Filter Values and then select Restore to Default.
Link Relationship Between On-Screen Filters
By default, all the on-screen filters that you applied to the same data components in a web report are interlinked. The link relationship is reflected on the filter values dynamically: selecting a value in one on-screen filter will result in that values which do not belong to the selected value, contain the selected value, or relate to the selected value are grayed in all the other linked on-screen filters for distinguishing. For example, there is a filter control based on the field Country and another on City and they both are applied to the same table. When you select USA in the Country filter control, the values in the City filter control change as follows: if the filter control has a scrollbar, Server displays the cities belonging to USA in the upper area of the filter control, and put the other cities in the lower area and grays them out; if it has no scrollbar, all the values remain their positions and Server grays out the values not belonging to USA. In both cases all the values are still selectable.
When using a filter control, you can determine whether to make the filter control apply the link relationship via the Link to Other Filters option.
See an example below showing the logic of other linked on-screen filters:
When:
- Filter1 is applied to DC1, DC2, and DC3.
- Filter2 is applied to DC1.
- Filter3 is applied To DC2.
- Filter4 is applied to DC2 and DC3.
The result:
- For Filter1, other linked filters are Filter2, Filter3, and Filter4.
- For Filter2, other linked filter is Filter1.
- For Filter3, other linked filters are Filter1 and Filter4.
- For Filter4, other linked filters are Filter1 and Filter3
 Previous Topic