Title, Labels, and Legends
Logi Classic Chart elements include numerous attributes and supporting elements that can be used to tailor their chart titles, labels, and legends. These help developers get the right "look" for their charts, thereby helping users understand what they're seeing.

Space for titles is automatically allocated for all charts.
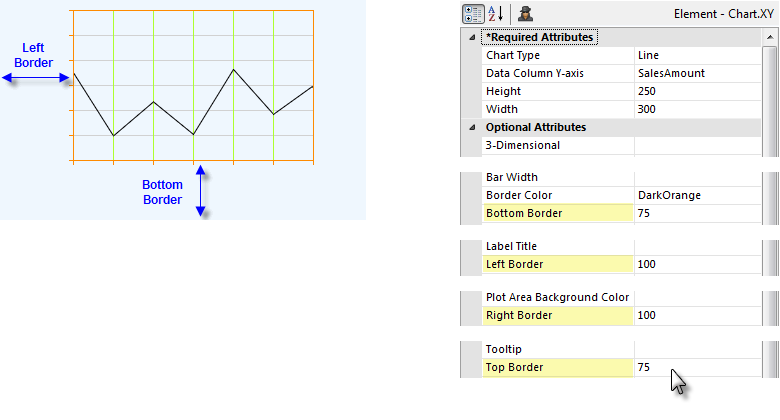
These indicate, in pixels, the distance on each side from the chart canvas to the edge of the chart image space. The overall vertical size of the chart is therefore calculated
as the sum of the Top Border + Height + Bottom Border. The horizontal size calculation is Left Border + Width + Right
Border.

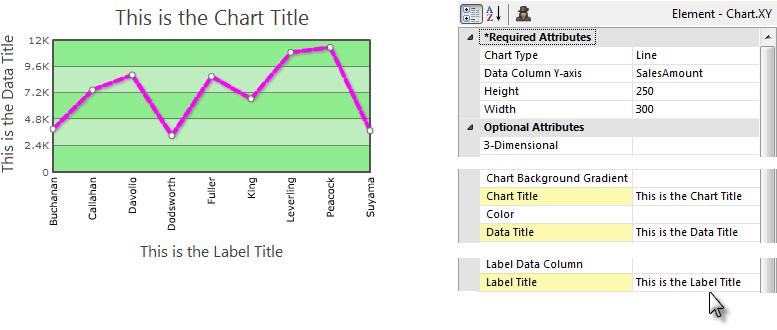
Titles for the chart, data, and labels can be set using the Chart Title, Data Title and Label Title attributes as shown above.

Static Chart titles that are longer than the width of the chart itself are automatically truncated and have an ellipsis ("...") appended to them, as shown above left. In Animated Charts, the title text will wrap to another line.
Static Charts can also use the Chart Title Font child element to set the title font, color, size, angle, and alignment.
Static Chart titles can also be rendered in multiple colors, as shown above right, by using CDML tags directly in the Chart Title attribute value to specify different font colors, sizes, etc. Find out more about CDML in Classic Chart Label Formatting. The example shown above was produced using this value:
<*color=0000FF*>Multi-Color <*color=FFD700*>Chart <*color=BA55D3*>Titles <*color=000000*>Available Too!
All charts include a Max Label Length attribute, which specifies the maximum number of characters that will be displayed for a label before the text is trimmed and the remainder replaced with an ellipsis (...). This truncation is also applied to Legend labels for Chart.Pie, if a Legend is in use (it is not applied to legends for other types of charts).
Static XY and Pie charts include a Label Column Data Type attribute, which can be used to set the way in which the charting engine will interpret the data specified in the column named in Label Data Column X-axis. This can be useful, for example, when you want dates in the data to be presented as text in the chart's X-axis labels.

As shown above, labels can be formatted by adding a Label Font element, providing control over font family, size, color, angle, and decimal point appearance. Font angle is only configurable for Static charts, not for Animated charts.
A Label Scale element is also available for controlling the appearance, size, and frequency of tick marks along the scales. One of its modes is LinearTime, which plots points evenly end-to-end according to an X-axis value, for use with Line and Area charts.
Labels can also be formatted using the CDML formatting language; find out more about CDML in Classic Chart Label Formatting.

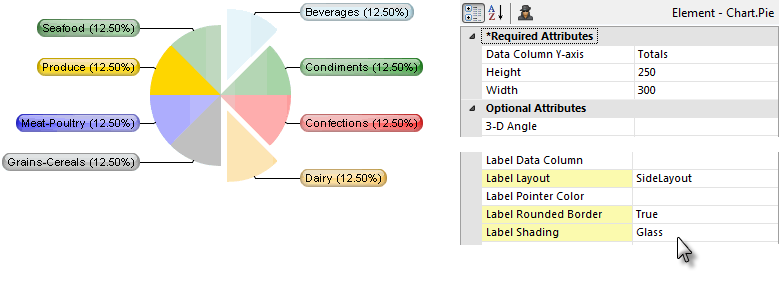
Attributes of the Static Pie chart allow the position, shape, and shading of chart Labels to be set.

Legends provide an explanation of some of the visual informationin a chart, which is often color-related. In the example above, the legend associates products with colors. In Static charts, two elements, Legend and Legend Font, shown above, control the location, size, font, border, orientation, and background color of legends. In some Animated charts, providing a value for their Legend Title attribute automatically generates the legend. The association between the colors and the data is also generated automatically.

When the Legend element's Legend Filter attribute has been set to True, it becomes possible to dynamically filter the data in some Static charts, including Pie, Line, Area, Bar, and Polar charts, by clicking items in the Legend, as shown above.