Supporting Elements
A number of elements make up the family used to create heat maps. Each element, its function, and its special attributes are discussed below:
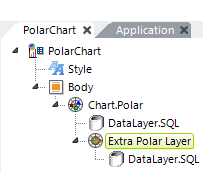 | Extra Polar Layer ElementAdds another "layer" (charted dataset) to the Polar chart, allowing multiple charts to be combined. Multiple layers in various chart styles (PolarArea, PolarLine, PolarSpline, etc.) are placed one on top of another in the same chart. The data for each layer comes from either columns in the main datalayer or from another datalayer beneath this element (shown). Attributes include: Data Column Y-axis- (Required) The name of the column in the associated datalayer that contains the value data for each record. Polar Chart Type - (Required) The type of Polar chart to be displayed: PolarLine, PolarScatter, PolarBubble, PolarArea, PolarSplineLine, or PolarSplineArea. Legend Label - Adds a label for this layer to the legend (if shown); a color-keyed symbol is automatically included. Transparency - Level of visual transparency for the plotted data in this layer. Values range from 0 (opaque) to 15 (completely transparent). Use medium-level transparency (8-10) to allow different chart layers to be seen through each other. Default value is 0. |
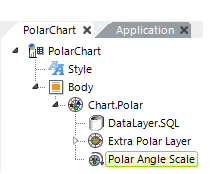 | Polar Angle Scale ElementThe element controls the angular axis scaling options. Attributes include: Fixed Scale Lower/Upper Bound - Sets the lower and upper bound, in degrees, of the circular scale. Numbers outside of range 0-360 are ignored. If left blank, automatic scaling occurs based on the data. If Lower Bound is specified, an Upper Bound must also be specified. Scaling Mode - Determines the way in which angle (X-axis) data is plotted. Standard scaling plots the data in an enumerated manner; each point (row) returned in the datalayer is evenly spaced. This works fine in many cases, especially when there are no missing data points. Linear scaling plots points based on an X-axis value; the X-axis is spread evenly end-to-end, even though the data points are not. Linear spacing works with either numeric or date/time values. Linear Tick Increment - When the Scaling Mode (previous attribute) is set to LinearNumber, this attribute controls how tick marks are created around the perimeter of the chart. Enter a number (in degrees) to specify the frequency with which tick marks will appear or, if working with date/time values, use one of the appropriate values such as Year or Week. Use Auto to automatically set an appropriate frequency based on the data. |
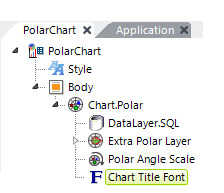 | Chart Title Font ElementThis optional element is available as a child to all chart elements. It controls the Font, Color, Size, and Angle (orientation) of the chart title. The title text itself is set in the Chart.Polar element. |
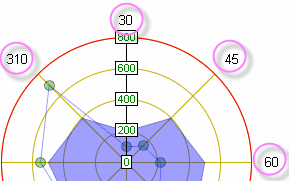
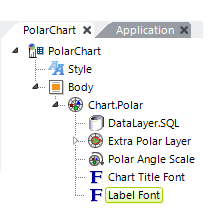 | Label Font ElementThis optional element is available as a child to all chart elements. In a polar chart, it controls the formatting (font, color, size, number of decimal points, and text orientation) of the angle (X-axis) data (shown circled in the image below).
|
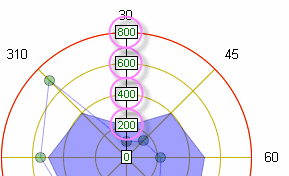
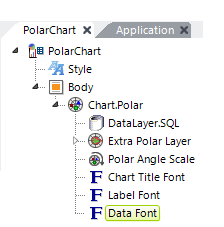 | Data Font ElementThis optional element is available as a child to all chart elements. In a polar chart, it controls the formatting (font, color, size, and text orientation) of the value (Y-axis) data (shown circled in the following image).
If this element is omitted or the Color attribute is left blank, the data appears in Black. |
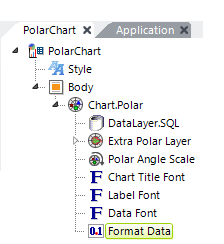 | Format Data ElementThis optional element is available as a child to all chart elements. It allows data values can be formatted for different decimal positions and European-style characters. |
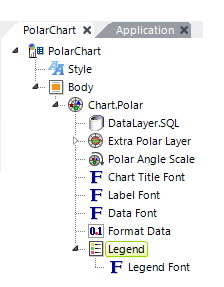 | Legend ElementThis optional element is available as a child to all chart elements. It displays a chart legend, in which each chart item is listed with a representative color and possible symbol. Attributes include top and left offset, border color, orientation, and background color. In a polar chart, the text for a legend entry must be set in the Chart.Polar and ExtraPolarLayer elements. This element's Legend Filtering attribute enables the ability to click legend entries at runtime and add or subtract their related objects from the chart.Legend Font ElementThis optional elements controls the formatting (font, color, size, and text orientation) of the text in the chart legend. |
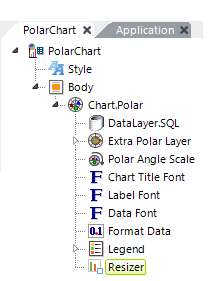 | Resizer ElementThe Resizer element adds draggable controls to the bottom and right sides of the chart that allow the user to resize the chart at runtime. When the user completes the drag/resize operation, the chart is refreshed from the server. The new size is remembered for the chart for the current session. The default height and width of the resizer are set to 50 pixels each. |
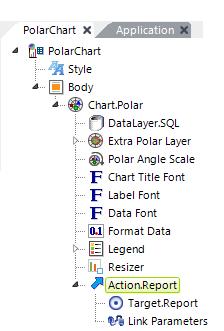 | Action ElementThis optional element provides click-event handling for the chart to allow a variety of actions such as redirection, process calls, etc. It works for the entire chart, not for individual data points. |
 If this element is omitted or the Color attribute is left blank, the data appears in Black.