Adding Drill-down Capabilities
One of the most attractive features of Google Maps is their
drill-down capabilities: clicking a Map Marker in a map causes a
pop-up info panel to open, which can contain detail information. The same
is true for Map Polygons - they can also be clicked in order to drill into
the data. Continuing with the previous example, found in Creating a Map with Polygons, here's how this capability
is added:
-
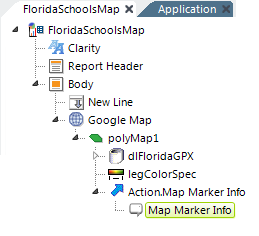
In the report definition, start by selecting the Map Polygons element.
Beneath it add an Action.Map Marker Info element, and then
beneath it, a Map Marker Info element, as shown above. Neither
needs any configuration beyond being given an ID.
-
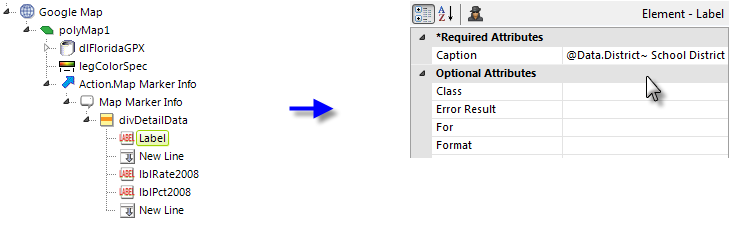
Beneath the Map Marker Info element, add a Division element and
beneath it add several Label and New Line elements, as
shown above. The Division allows a uniform style to be applied to the
Labels, and the Labels display detail data from the datalayer, which is
still in scope. Note the use of an @Data token to display the school
district name.
-
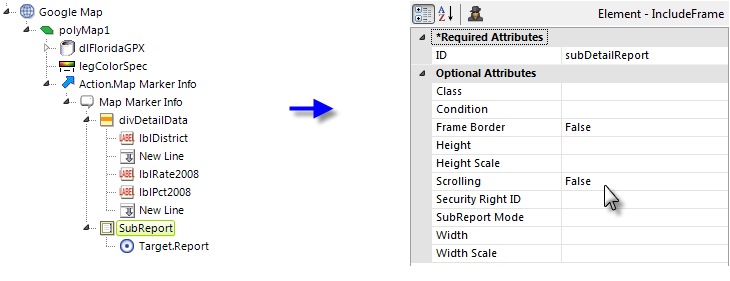
Next select the Map Marker Info element again and beneath it add
SubReport and Target.Report elements, as shown above. This
will allow you to add a chart or table, defined in a separate
definition, to the pop-up info panel.
 The
Frame Border and Scrolling attributes are set to
False so that the chart or table will embed smoothly into the
pop-up panel.
The
Frame Border and Scrolling attributes are set to
False so that the chart or table will embed smoothly into the
pop-up panel.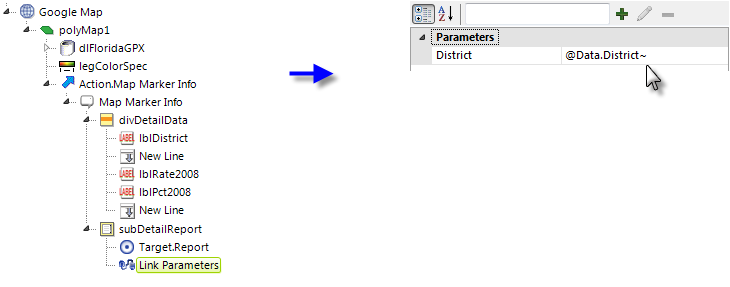
-
Finally, a Link Parameters element can be added beneath the
SubReport element, as shown above, to pass identifying information to
the detail report.
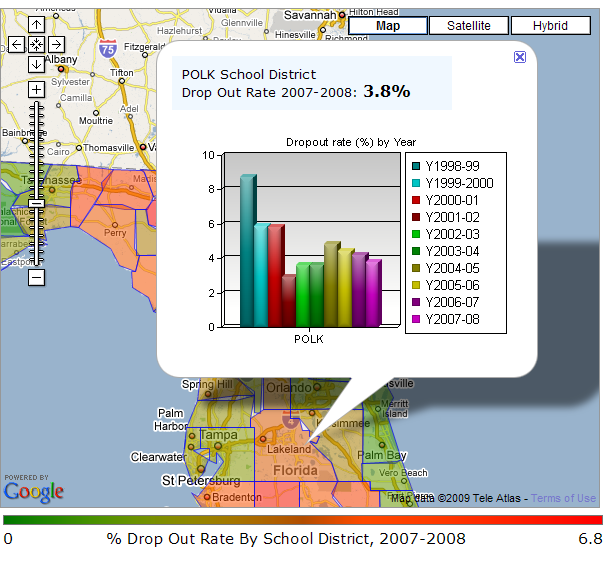
The resulting pop-up information panel displayed when a polygon is clicked is shown above.