Leaflet Maps - About Mapping Data
Data used for maps typically contains, at the least, address information. When this information is sent to the map server, the map generated will be scaled to fit the data into the dimensions you set for the map (in the Leaflet Map element).

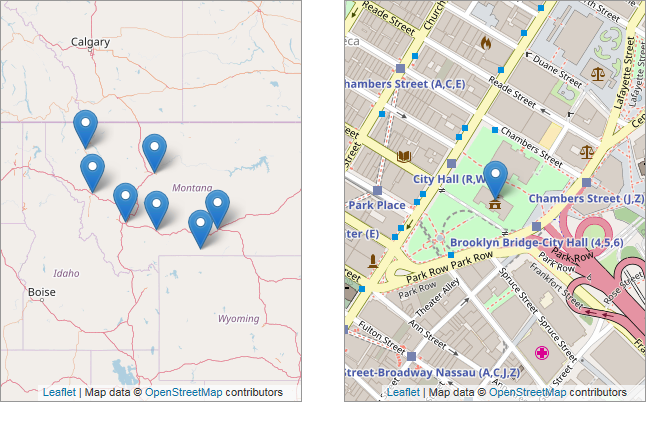
For example, if your data only includes state/province information for a single state, the map generated will be scaled to show as much of the state as necessary to include all of the map markers (above, left). This could be the result, for example, of a SQL query statement that includes a WHERE State = 'MT' clause.
However, if your data includes street address, city, and state/province information, the map generated will be scaled as a street-level map (above, right). This could be the result, for example, of a SQL query statement that includes a WHERE City = 'New York' clause.

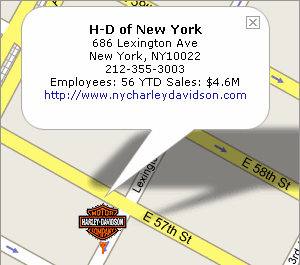
As shown above, one of the benefits of the interactive nature of these maps is that you can display additional information when the map marker is clicked. Your data might include business intelligence data in addition to the address information such as, for example, revenue figures or employee counts. This data can be displayed, as shown above, in the Info Window that pops up when a marker is clicked. The Info Window can also contain images, gauges, sub-reports, and links, all driven by data.
If your data already includes latitude and longitude positioning data, so much the better. The use of Geocode Column elements to provide that data involves additional requests to the web service and, depending on the map server's usage terms, that could mean exceeding the transaction limit or paying additional transaction fees.
Support for data that includes "MultiGeometry" tags is included.