Showing Totals for Stacked Series
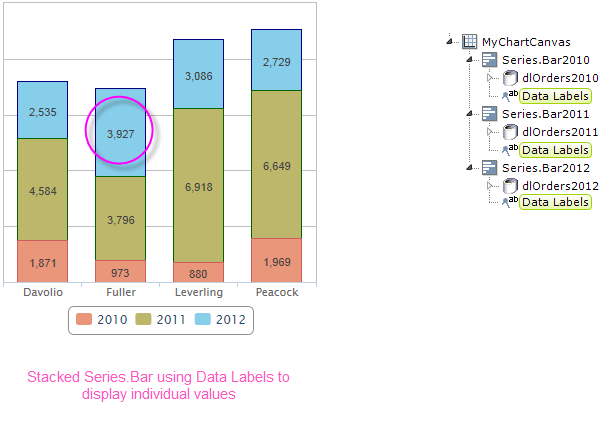
When multiple Series are used and stacked, the Data Labels element can be used to display the individual data values. However, what if you want to display a total of the stacked values?
The examples below illustrates the first scenario: Data Labels elements used beneath its Series.Bar elements, resulting in individual values being displayed within the bars.

![]()
 New for 14.2 One Data Labels element attribute, Series Name as Caption, allows you to specify the y-axis label, x-axis label, or legend label as the data point value inside the chart.
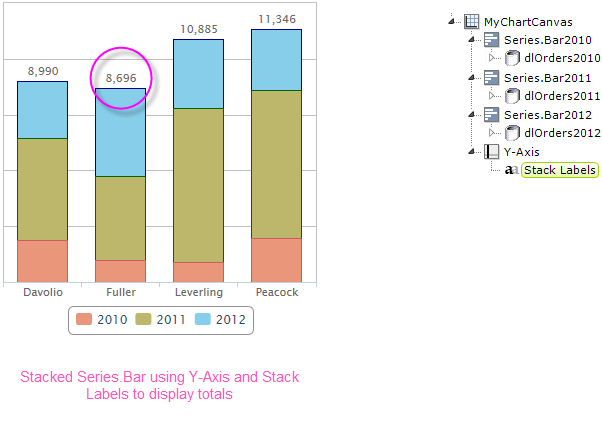
However, if you don't use Data Labels but instead use a Y-Axis element and its Stack Labels child element, the stacked values will be totaled and displayed above the bars, as shown below. The Stack Labels element allows you to configure the font-related, format, and positioning attributes of the total text.
