Series.Scatter - Using the Marker Points Element
A "marker point" is a symbol that appears on the chart at each data point. These behave differently in a Scatter chart than in other types of charts: the marker point is the chart symbol itself. When the Marker Points element is used as a child of Series.Scatter, several properties can be configured.

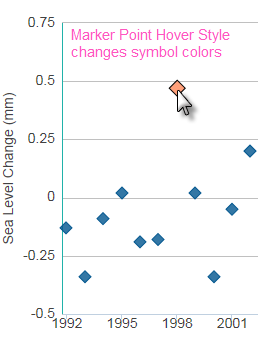
The default marker points are shown earlier, in the "Using Data Labels" topic. The marker points shown above are one of five symbol options that can be used. The Marker Points element allows you to control the symbol choice, its color and border color, and its transparency. When the cursor hovers over it, a symbol's color can change - the Marker Points Hover Style child element lets you configure that behavior and other properties.