Input Selection
The Chart Canvas element's Series child elements cause a data visualization (the chart) to be rendered in the canvas. The Input Selection family of elements is available beneath some Series elements and provides the ability to interactively select portions of charts using the mouse and initiate actions using the selected data.
The following topics discuss the Input Selection child element:
About Input Selection
Input Selection elements turn a chart into an input control, allowing the user to make selections on the chart at runtime. The data represented within the selected chart area can then be used with other actions. Drilling into detail data is one example of how this can be used.

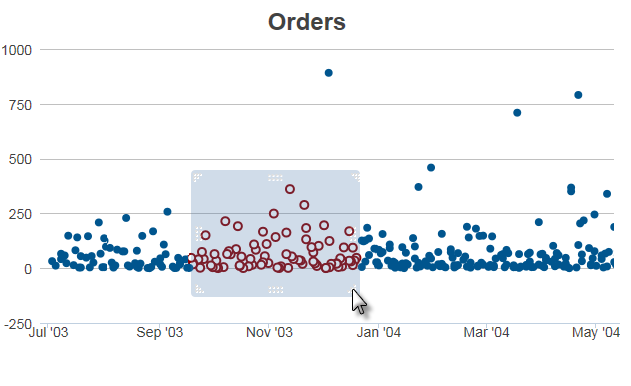
In the example above, at runtime, a "selection area" has been "drawn" (by dragging the mouse)
onto the chart to select values. The values within the selection area are
automatically submitted to the next definition as Request tokens. Page submission may or may not be triggered when drawing the area ends. The appearance of selected areas or points can be independently styled.

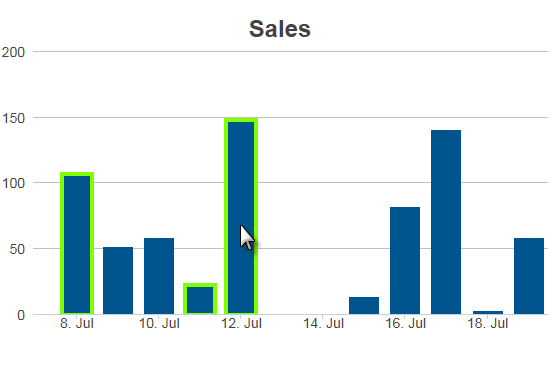
The example shown above uses Input Selection Point configured to allow selection of multiple data points. In this case, the page submission is not triggered by the selection process.
Let's examine the elements used for chart input selection.