Providing Data for Sparklines
Sparklines are very easy to implement and use their own datalayers to
retrieve data:
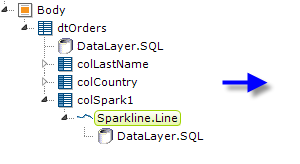
In the example shown above, a Sparkline.Line element has been
included in a Data Table column.  The Data Table has its
datalayer and the Sparkline has its own, separate datalayer.
The Data Table has its
datalayer and the Sparkline has its own, separate datalayer.
The data used by the Sparkline needs to be limited to that related to the table row that the Sparkline resides in. To do this, if using DataLayer.SQL to retrieve data for the Sparkline, the query can reference the data from the Data Table's datalayer using an @Data token. So the (Sparkline) query might look like:
- SELECT * FROM orders WHERE EmployeeID = @Data.EmployeeID~
If the Sparkline data is retrieved from other datasources, a Compare Filter or Condition Filter can be used to limit the data in the datalayer to just that needed for the chart. For example, if you use a Compare Filter, its Data Column attribute value might be EmployeeID and its Compare Value attribute would be @Data.EmployeeID~.
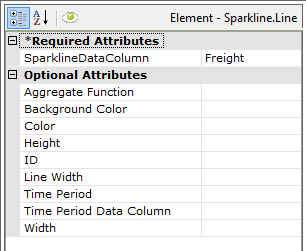
All that's necessary to produce the Sparkline itself is to identify a data
column in the Sparkline Data Column attribute value, as shown
above, which provides the y-axis values. Each row in the datalayer is then
plotted on its own chart.
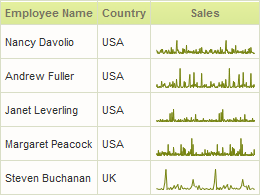
The resulting Data Table, with Sparklines, is shown above. Height and width values may be specified but, if they are not, they will be determined automatically.
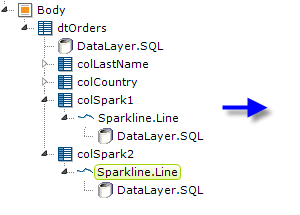
Common implementations of Sparklines show data that's grouped by time
period and aggregated. Sparkline elements include time-oriented grouping
attributes and a built-in aggregation function, so you don't have to
manipulate the datalayer data using additional elements (although you
may do so).
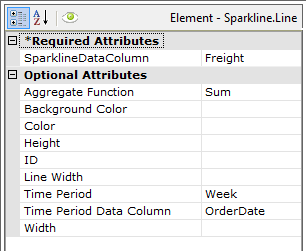
In the example shown above, the Sparkline Data Column and
Aggregate Function attributes are used to sum the
Freight data column values, which provides the y-axis values. There
are two attributes for grouping data by time, the Time Period and
Time Period Data Column attributes, which produce the x-axis values
of the chart. In the example, they're set to Week and the
OrderDate data column, respectively.
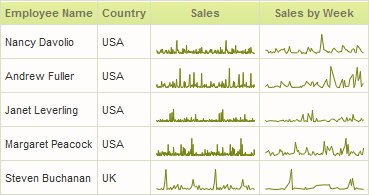
The resulting Data Table is shown above. This, essentially, allows you to increase the granularity of the Sparkline.
 The Time Period attribute will only work with
date-related values; even though they're shown in Studio, the Hour,
Minute, and Second options are not valid with this element. Similarly,
data in the column specified in the Time Period Data Column must be
DateTime type data that includes date values, not just time values.
The Time Period attribute will only work with
date-related values; even though they're shown in Studio, the Hour,
Minute, and Second options are not valid with this element. Similarly,
data in the column specified in the Time Period Data Column must be
DateTime type data that includes date values, not just time values.
However, if you wish to display values grouped by time, add a Time Period Column element under your datalayer. Use a Group Filter to group the data on the Time Period Column and a Group Aggregate Column element to aggregate it. Enter the ID of the Group Aggregate Column element in the Sparkline element's Sparkline Data Column attribute.
Aggregations with Null values are excluded by default. To include them, create the constant rdCalculationsIncludeNulls and set it to True.