Using Group Header and Group Summary Rows
One effective and uncomplicated method of displaying hierarchical data in a Data Table is to use Group Header and Group Summary Rows. As is often the case, the first step is to understand the data and what groupings are required.
In this example, we'll group the data by Order ID. The Order ID and
Customer ID will appear in a group header. We'll also summarize the
Freight costs by order and show them as a total for each group in a group
summary row.

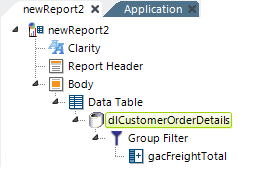
The image above shows a report definition in which a SQL query has been used to retrieve data from a JOIN of Customer, Orders, OrderDetails, and Products tables. A Group Filter element has been added to create a hierarchical arrangement of the data, based on Order ID, and must be given an element ID ("grpOderID") for this implementation.
A Group Aggregate Column element has been added to create grouped totals of the Freight column.
Group filters create data groups by looking for unique values in a
particular column. By default, the first row with a unique value is kept
and the duplicate rows are discarded. Developers must choose to keep
all grouped rows when building and presenting hierarchical data
within a Data Table, by setting the Group Filter element's
Keep Grouped Rows attribute value to True.

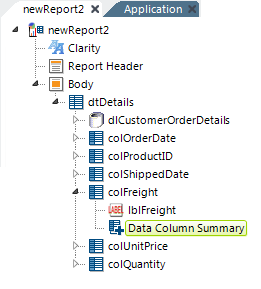
In the next step, as a shown above, Data Table Column elements have been added to display the detail data. Each of these columns has a child Label element.
In order to summarize the Freight costs, we'll add a Data Column Summary element to the definition beneath the Freight column. This element's attributes are then set to Sum the Freight column values.

Next, a Group Header Row element has been added, as shown above.
The Group Header Row requires that we identify the Group Filter we used earlier (that's why we gave it an element ID), and we'll configure it to insert ("prepend") a blank row before each group except the first one.

Child elements, shown above, are added beneath the Group Header Row, and are configured to show the Order ID and Customer ID. The second Column Cell element's Column Span attribute is set to 5, as there are six total columns. The Label elements are configured to display the data tokens from the appropriate columns.

Finally, a Group Summary Row is added, as shown above. It's configured as shown to use the appropriate Group Filter and a Caption is provided. This element will automatically display summaries beneath any column that has a Data Column Summary child element and the summary data will inherit the alignment and formatting of its parent column.

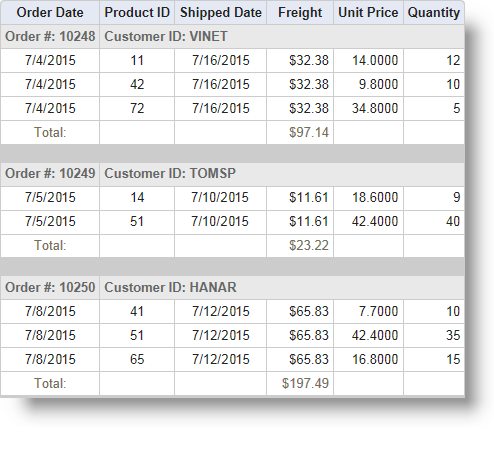
A portion of the resulting Data Table is shown above. Note how the data has been arranged in a hierarchy.
When printing reports directly from the browser or from a PDF export, developers can choose to print each data grouping on separate pages. Set the Group Header Row or Group Summary Row element's Printer Page Break attribute to True to insert a page break before each group header row.
Group Header Rows and Group Summary Row elements now include a Show Modes attribute, allowing you to hide them when exporting to PDF. In addition, if using these two elements with their Append Blank Rows or Prepend Blank Rows attributes set to a number, blank rows will now not be appended/prepended when the report is exported to PDF.
In a Data Table report, when Append Blank Rows to the Group Summary Row is set, the width of the newly added blank rows will be the same as the largest width in the existing Table Row.