Planning the Tutorial Crosstab Table
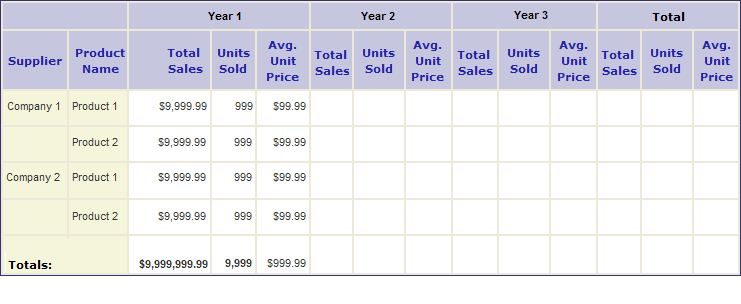
Before adding elements to a definition, it's a good idea to first plan the table (or chart) that you're trying to produce. A simple sketch can often provide clarity and save you from having to re-work your definition later. Look at the Crosstab Table layout model shown below:

The table is limited to three years of data, groups products by company, provides summarized data for each year in several categories and for all products, and summarizes across all years as well. With this layout in hand, we can proceed to build the table.
The following examples demonstrate how to use a variety of elements to produce this table. The complete, downloadable definition for this Crosstab Table is available in the Crosstab Table Sample Application on DevNet.