Series.Pie - Shaping the Pie
You can control the shape of the Pie chart in several ways.

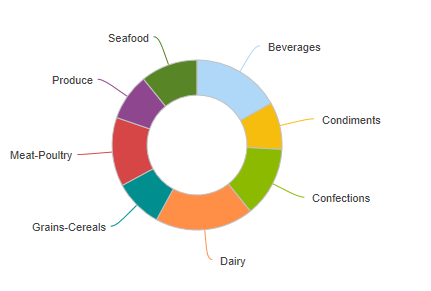
The example above shows a Pie chart with a "donut hole" in its middle. This is controlled by setting the Series.Pie element's Donut Hole Size attribute to a value, in pixels, equal to the diameter of the hole.

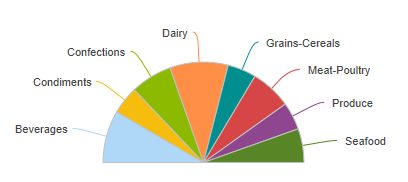
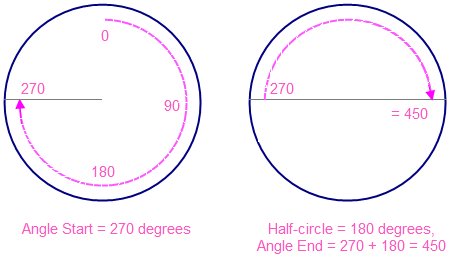
The example above shows a Pie chart that only fills part of the usual 360-degree pie space. This is created by using the Series.Pie element's Angle Start and Angle End attributes. The example uses Angle Start = 270 degrees and Angle End = 450 degrees. How do we come up with those numbers?

Assume we want a Pie chart that's a half-circle, above the equator, like our previous example. To find the starting angle, we navigate clockwise around a circle to the starting point, as shown above left, to 270. Then to find the ending angle, we add the number of degrees in a half-circle (180) to the starting angle, or 270 + 180, which equals 450, as shown above, right. Using this method, you can create a Pie chart that's any portion of a complete circle.