Series.Bar - Using the Data Labels Element
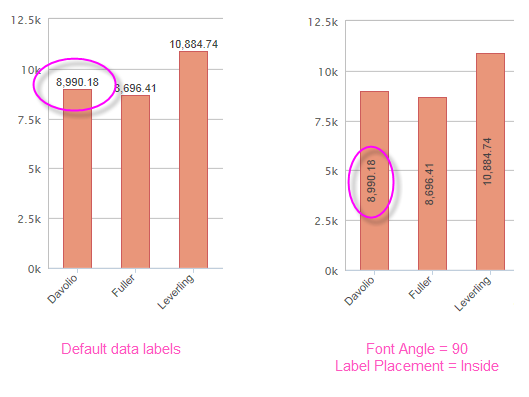
A "data label" is text shown near each data point that shows its value. When the Data Labels element is used as a child of Series.Bar, text representing the data values will appear on the chart:

By default, with a single data series, the data labels will appear outside the bar, as shown above, left. The example above, right, shows data labels placed inside the bars and rotated 90-degrees. When series stacking is being used, the default is for data labels to appear inside the bars.
The Data Labels element has attributes that allow you to control the font family, color, size, and weight, the data format, border color, and positioning of the text.  New for 14.2 One attribute, Series Name as Caption, allows you to specify the y-axis label, x-axis label, or legend label as the data point value inside the chart.
The Data Labels element's color-related attribute values can be set using @Chart tokens.