Series.Area Spline - Using the Marker Points Element
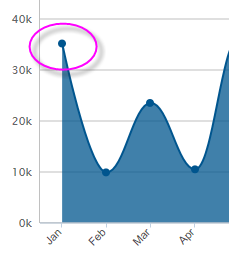
A "marker point" is a symbol that appears on the chart at each data point. When the Marker Points element is used as a child of Series.Area Spline, a small dot matching the color of the area will be displayed at each data point:

The default marker points are shown above. The Marker Points element allows you to select a different symbol for the marker point, and to control its size, color, border color, and transparency. When the cursor hovers over a marker point, it's automatically enlarged slightly.