Legend
The Chart Canvas element's Series child elements cause a data visualization (the chart) to be rendered in the canvas. Series elements include a Legend Label attribute that let you specify the text that appears within the chart legend for this data. If one or more Series elements has a value in this attribute, a horizontal legend will be displayed; otherwise no legend is displayed.
The following topics discuss the CCC Legend child element:
- Legend Filtering
- Legend Attributes
- Styling the Legend Caption
- Styling the Legend Items
- Styling the Legend Navigation Arrows
About the Legend
Chart legends provide visual clarity when multiple series are used. The Legend element can be used to control many aspects of the legend display.

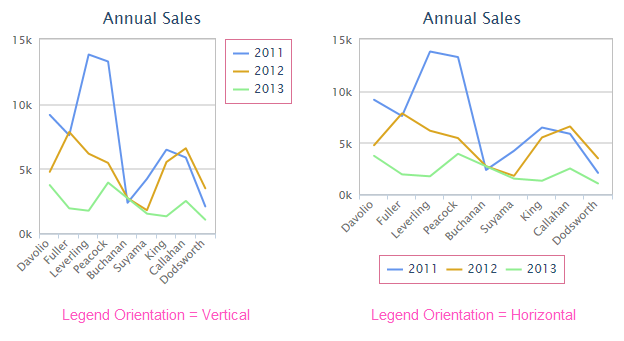
In the example above, legends are shown in Vertical and Horizontal orientations, which is set using Legend element's Orientation attribute.
![]() The plot area is automatically scaled to accommodate the inclusion of the legend within the canvas area.
The plot area is automatically scaled to accommodate the inclusion of the legend within the canvas area.

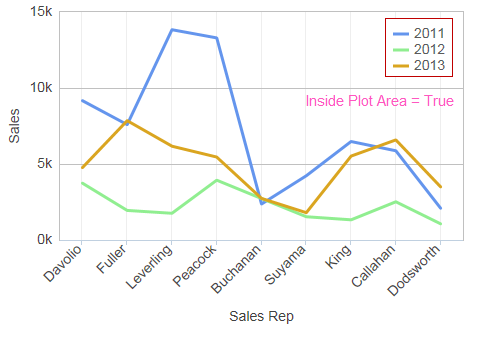
In the example shown above, the Legend element's Inside Plot Area attribute has been set to True, moving the legend inside the plot area. Additional fine positioning has been done using the element's Offset X and Offset Y attributes. The Legend element has a variety of attributes that can be used to customize its border, background, positioning, symbols, and more. These are described in detail in Legend Attributes. Even if the Legend element is included, the legend will not be displayed if there is no data to be charted.