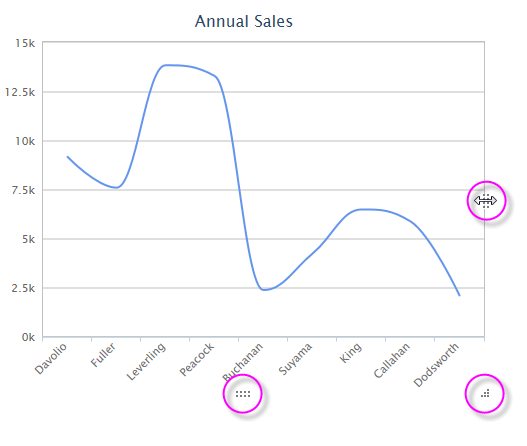
The Resizer
The Chart Canvas element's Resizer child element enables functionality that allows the user to resize the chart at runtime.

When the Resizer element is included, the "resizer handles" shown in the example above, will appear when the cursor passes near or over them. These handles are just inside the canvas border, and the user can click and drag them to resize the chart.
The dimensions of the resized chart are stored for the duration of the current session only.
When the Resizer is used with a chart in a Dashboard that has a columnar layout, any resizing of the chart is saved in the Dashboard's Save File, which makes it persist beyond the user's current session.
Attributes
The Resizer element has the following attributes:
| Attribute | Description |
|---|---|
| Maximum Height | Sets the maximum height, in pixels, that the chart may be expanded to by dragging the handles. |
| Maximum Width | Sets the maximum width, in pixels, that the chart may be expanded to by dragging the handles. |
| Minimum Height | Sets the minimum height, in pixels, that the chart may be collapsed to by dragging the handles. If left blank, the minimum is 100 pixels. |
| Minimum Width | Sets the minimum width, in pixels, that the chart may be collapsed to by dragging the handles. If left blank, the minimum is 100 pixels. |