Regression
Linear prediction is a mathematical operation in which the future values of a dependent variable are estimated as a function of previous samples. The Forecast.Regression element implements:
- Simplelinear regression, where values are based on a trend line
- Autoregression, which predicts an output based on previous outputs, using the "Burg" method
- Non-linear regression, which displays the relationship between dependent and independent variables using a curvilinear function and may provide more accuracy. Available curvilinear functions include:
- Exponential
- Logarithmic
- Polynomial2
- Polynomial3
- Polynomial4
- Polynomial5
- Power
Input Data Requirements
Data should conform to the following requirements:
- Dependent data column data should be Numeric data type
- Dependent data column data should not contain NULL values
- Independent data column may have any data type (if data type is not Numeric, independent data column will be replaced with an integer enumeration (1,2,3,...RowCount).
- Dataset should be in ascending order by independent data column value
- Forecast Length attribute should be less than original row count (if user defines Forecast Length as more than row count, Forecast Length value will automatically be truncated to 20% of RowCount)
- Some of the regression methods require a minimum number of rows (for example, Autoregression requires at least one more row than the value of the AutoRegressive Order attribute, and Polynomial3 requires at least four rows)
Results
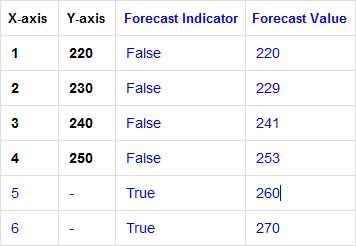
As a result of the forecast operation, two new columns will be added to the datalayer. The names of these two columns will be drawn from the element's attributes:
- Forecast Indicator Column ID: this column will contain a boolean flag, set to True if the row contains a forecast value
- Forecast Value Column ID: this column will contain the forecast value for each row of the original dataset
The following table shows the effect on the datalayer of a forecast operation:
