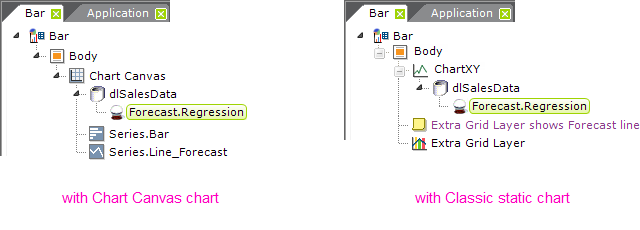
Using Forecast.Regression
The Forecast.Regression element uses one of several regression analysis functions. Regression analysis is recommended when the focus is on a relationship between a dependent value and one or more independent values. It's useful, for example, when values in the X-axis are "uneven" (are separated by varying differences).

The Forecast.Regression element is a child of any datalayer, as shown above, and its attributes include:
| Attribute | Description |
|---|---|
| Dependent Data Column | (Required) Specifies the name of a column returned into the datalayer. It represents data values for the Y-axis. |
| ID | (Required) A unique element ID. |
| Independent Data Column | (Required) Specifies the name of a column returned into the datalayer. It represents data values for the X-axis. |
| Regression Type |
(Required) Specifies the type of regression analysis to be applied.
|
| Autoregressive Order | Used only when Regression Type is set to Autoregressive. Specify a value between 1 - 8 (default =3) to define how many previous values have to be observed for analysis. |
| Forecast Indicator Column ID | Specifies the name of a new column to be added to the datalayer, with value set to True, for each row used in the forecast analysis. If left blank, the column will automatically be named "{ElementId}" + "ForecastIndicator". |
| Forecast Length | Specifies the actual number of rows to analyze. A value entered that is greater than the total number of rows will be reduced to the total number of rows minus one. If left blank, 20% of the total number of rows will be used. |
| Forecast Value Column ID | Specifies the name of a new column that will be created in the datalayer to hold each forecast value. If this value is left blank, the forecast value will be added to the value of the Dependent Data Column. |