Applying the Crosstab Filter to a Crosstab Table
The following example illustrates how the Crosstab Filter is used with a Crosstab Table:
- Our goal is show total freight costs per employee per year. As shown above left, we start by retrieving Order data and joining it with to Employee data, based on Employee ID, which gives us the order data and the last name of the employee responsible for the order.
- We want to show yearly summaries so, because the Order data is time-related, we use a Time Period Column element to parse out the Year value from the OrderDate column. Time Period Columns make working with parts of dates incredibly easy.
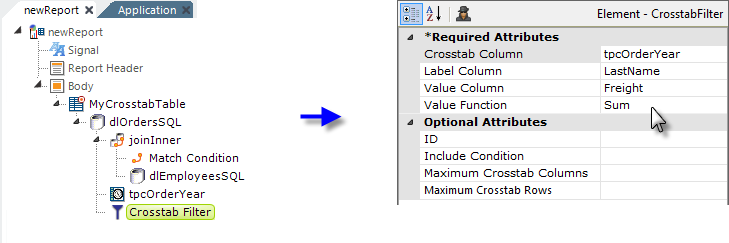
- Then we add a Crosstab Filter element beneath a datalayer, and configure is as follows:
- Set its Crosstab Column attribute to the data columns we want to see across the top. These will be the OrderDate years, so enter the tpcOrderYear column name here.
- Set its Label Column attribute to the row labels we want to see down the left. These will be the employees' last names, so enter the LastName column here.
- Set its Value Column attribute to the aggregated values we want to see at the intersections of the previous to items. This will be the freight cost, so enter the Freight column name here.
- Finally, set its Value Function to the type of aggregation we want performed on the freight cost, in this case Sum.
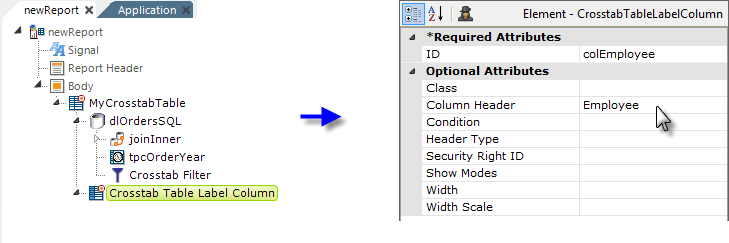
- Next we add a Crosstab Table Label Column element, as shown above left. This is the column our "label" information (the employee last name) will appear in and it's configured as shown.
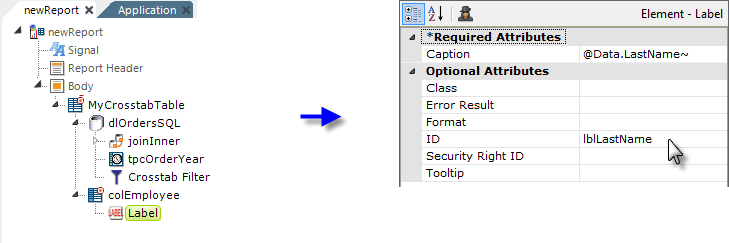
- Then, as shown above, we add a Label element beneath the column element to actually display the data, and set its Caption to the @Data token for the value (the employee last name) we want to show.
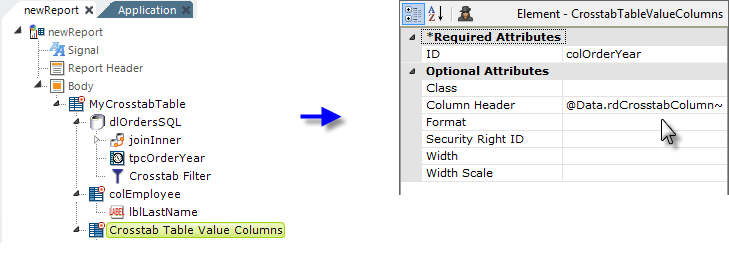
- Now things get a little more unusual: next we add a Crosstab Table Value Columns element, as shown above. This creates the columns (more than one) that will contain the annual aggregated freight value for each employee. So, it's unusual in that it creates multiple columns and also because it uses one of the special Crosstab Table tokens in its Column Header attribute, as shown above right. This token allows the column header to change depending on the data.
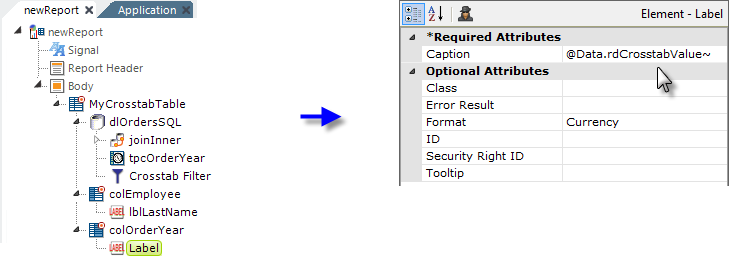
- And finally, we add a Label element to display the data. Its Caption attribute value is provided using another special Crosstab Table token, as shown above. This provides the aggregated freight value for the right employee and year.
Now, let's see the effect of all this work:
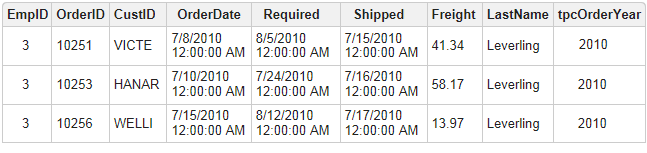
If we look at the data prior to passing it through the Crosstab Filter, the datalayer looks like the example shown above.
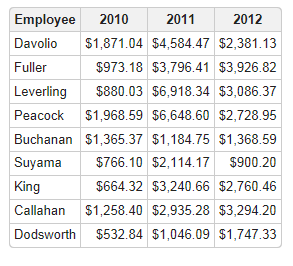
And here's what it looks like in the Crosstab Table.
Let's review the special Crosstab Table tokens, two of which were used to produce the results shown above:
| Token | Description |
|---|---|
| @Data.rdCrosstabColumn~ | The current Crosstab Table column header value. |
| @Data.rdCrosstabValue~ | The aggregated value for each label and column. |
| @Data.rdCrosstabValCount~ | The number of values aggregated to get the previous token's value. |
As we've seen, the Crosstab Table, using the Crosstab Filter, is a powerful tool for aggregating data and grouping it, especially by time periods.
Crosstab Extras
There are four child elements that can be used beneath a Crosstab Filter, as follows:
| Token | Description |
|---|---|
| Crosstab Row Summary Column | Use this element to generate aggregated values for the table's columns. This basically adds an additional column to the datalayer. You can view the aggregated values by adding a Crosstab Table Label Column and specifying @Data.x~, where x is the ID of this element |
| Extra Crosstab Calculated Column | By default, the Crosstab Filter produces a single value for each column and row combination. This element allows a formula to be used to create additional values. These values can be displayed in a Crosstab Table Value Column element. In the Label element use the special token: @Data.rdCrosstabValue-myID~ where "myID" is the ID of this element. The formula used may reference special crosstab tokens. For example, if the Crosstab Value Column is "Cost" and an Extra Crosstab Value Column is "Price", we can calculate "Profit" with: @Data.rdCrosstabValue-Price~ - @Data.rdCrosstabValue~ In this case "Price" is the ID value of an Extra Crosstab Value Column element. @Data.rdCrosstabValue~ represents the "Cost" because it's the main value created with the Crosstab Filter. |
| Extra Crosstab Label Column | Crosstab Tables always have a label column that determines how values are grouped together. For some Crosstab Tables, you may want to display additional columns so that they can be included in a Crosstab Table element. For example, you may use a field called "EmployeeID" as the main label column to create the Crosstab. But, if you want to also show the employees' names, you should add an Extra Crosstab Label Column for the first and last name columns. These extra label columns are for display only; they are not used when determining the crosstab table rows. Reference the value with @Data.myID~, where myID is the value of this element's ID attribute. |
| Extra Crosstab Value Column | By default, the Crosstab Filter produces a single value for each column and row combination. This element provides for additional values, which can be displayed in a Crosstab Table Value Columns element. In the Label element use the special token: @Data.rdCrosstabValue-myID~ where "myID" is the ID of this element. |