Enabling Panel Content Editing
If the goDashboardPanelEditing constant has been set to True, users can edit the visualizations in dashboard panels at runtime and save their changes. The Visualization Editing element, a child of the Dashboard element in the goDashboard definition, provides the functionality.
Restrictions: Visualization editing is available for dashboard panels containing charts, gauges, and tables created using Analysis Grid-type analyses, and that Analysis Grid must have been configured to work with Active Query Builder and Active SQL.

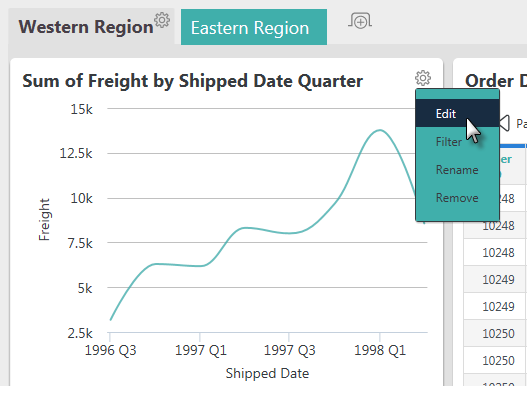
When enabled, an Edit option is added to a panel's gear icon menu, as shown above. Editing allows the user to adjust visualization options including appearance and column selection. Changes may be saved back to the dashboard, or not.
Panel content in a dashboard can come from a variety of sources so, even when enabled, some panels may have the option and some may not.
The Visualization Editing element has attributes that can be used to customize the controls presented to the user when editing the visualization. It also supports the use of a Template Modifier Files to customize the Editing pop-up panel and these template files are used:
| For Tables: | For Charts: | For Crosstab Tables: |
|---|---|---|
|
|
|