Events: beforeCreateChart and afterCreateChart
These two events can be used to customize Chart Canvas Chart options and properties. As you can guess, one event fires just before the chart is created and one just after it's created. The events include these parameters:
| Parameter | Description |
|---|---|
| id | The Chart Canvas Chart element ID. |
| options | The chart options object: the options structure for the chart. |
| chartCanvas | The Chart Canvas Chart container object. |
| chart | The chart object. |
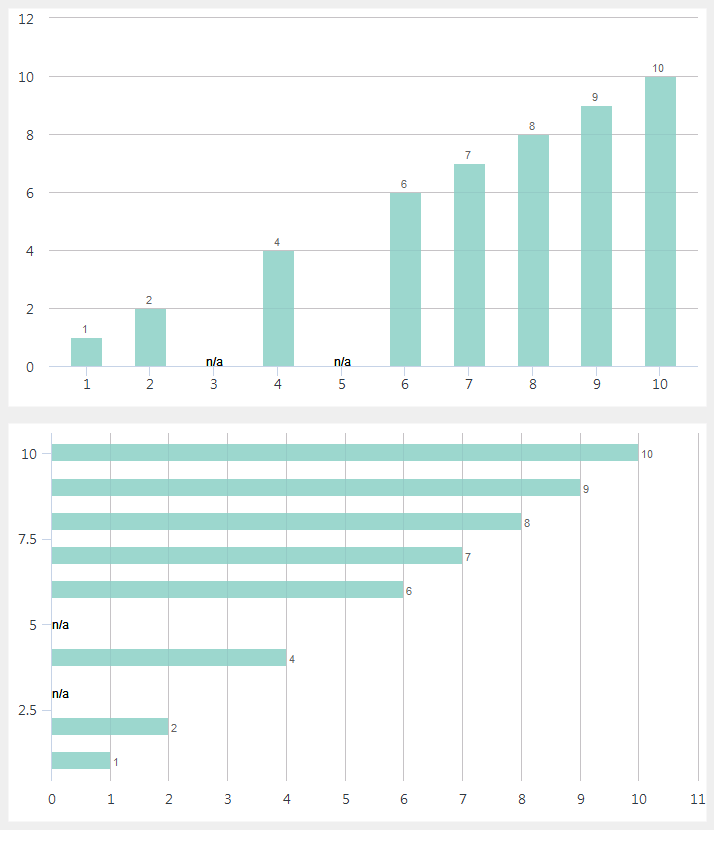
Here's an example that uses the beforeCreateChart event to cause the text "n/a" to appear on two charts when there are null data values.
First, here's the Logi element source code (![]() the JavaScript code is follows separately):
the JavaScript code is follows separately):
<Division ID="divNewAPI_Events" >
<ChartCanvas ID="verticalBarChart" >
<DataLayer Type="Static" ID="StaticDataLayer1" >
<StaticDataRow x="1" y="1" />
<StaticDataRow x="2" y="2" />
<StaticDataRow x="3" y="" />
<StaticDataRow x="4" y="4" />
<StaticDataRow x="5" y="" />
<StaticDataRow x="6" y="6" />
<StaticDataRow x="7" y="7" />
<StaticDataRow x="8" y="8" />
<StaticDataRow x="9" y="9" />
<StaticDataRow x="10" y="10" />
</DataLayer>
<Series Type="Bar" ChartYDataColumn="y" ChartXDataColumn="x" >
</Series>
</ChartCanvas>
<LineBreak />
<ChartCanvas ID="horizontalBarChart" ChartOrientation="SwapAxes" >
<DataLayer Type="Static" ID="StaticDataLayer2" >
<StaticDataRow x="1" y="1" />
<StaticDataRow x="2" y="2" />
<StaticDataRow x="3" y="" />
<StaticDataRow x="4" y="4" />
<StaticDataRow x="5" y="" />
<StaticDataRow x="6" y="6" />
<StaticDataRow x="7" y="7" />
<StaticDataRow x="8" y="8" />
<StaticDataRow x="9" y="9" />
<StaticDataRow x="10" y="10" />
</DataLayer>
<Series Type="Bar" ChartYDataColumn="y" ChartXDataColumn="x" >
</Series>
</ChartCanvas>
<IncludeScript IncludedScript="(see the JavaScript code that follows)" />
</Division>
And here's JavaScript code:
var verticalBarChartContainer = Y.one('#verticalBarChart');
verticalBarChartContainer.on('beforeCreateChart', function(e) {
setNAFormatter(e);
});
var horizontalBarChartContainer = Y.one('#horizontalBarChart');
horizontalBarChartContainer.on('beforeCreateChart', function(e) {
setNAFormatter(e);
});
function setNAFormatter (e) {
if (e.options.series == null) {
return;
}
if (!e.options.plotOptions) {
e.options.plotOptions = {};
}
if (!e.options.plotOptions.column) {
e.options.plotOptions.column = {};
}
e.options.plotOptions.column.dataLabels = {
enabled: true,
formatter: function () {
var str;
if (this.y !== null) {
return this.y;
} else {
if (e.options.chart.inverted) {
var chart = this.series.chart,
offset = this.point.barX + 3;
chart.renderer.text('n/a', chart.plotLeft, chart.plotTop + chart.plotHeight - offset).add();
} else {
var chart = this.series.chart,
offset = this.point.barX + this.point.pointWidth / 2 - 8;
chart.renderer.text('n/a', chart.plotLeft + offset, chart.plotTop + chart.plotHeight).add();
}
}
return false;
},
crop: false,
overflow: 'none'
}
}
And the resulting charts look like this:

You can see, as shown above, that where there are no data values, the text "n/a" has been inserted.