Thinkspace - Grouping Rows
The Thinkspace uses a proprietary data analysis technique to automatically group continuous data into various categories, called "bins". The key elements of the data "binning" process are:
- The actual distribution of the data.
- Ensuring a reasonable chart in generated.
- Producing a "human friendly" distribution.
You'll notice that data is already grouped and summarized when it's used in charts.
However, you may want to customize the grouping parameters. For Text-type data columns, you'll only be able to enable or disable Grouping, using the sliding Enable/Disable switch. For other columns of other data types, here's how to customize grouping:

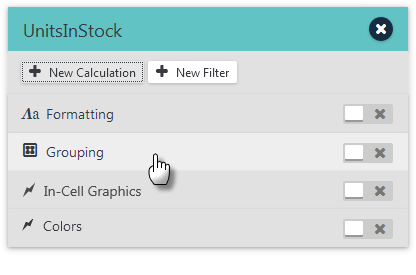
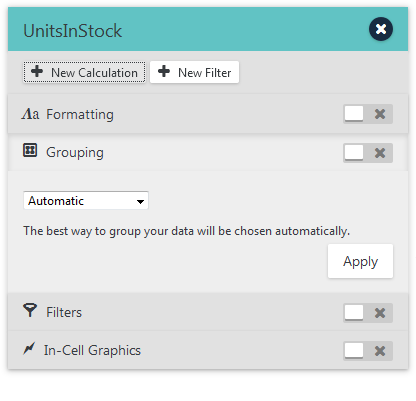
Click Grouping on a column's gear Menu, as shown above, and the menu option will expand to show a panel with the grouping controls. The drop-down list allows you to select the grouping method to be used. Options include:

- Automatic - The "best fit" grouping model for the data will be applied automatically, using a default number of bins, based on the key elements mentioned earlier.

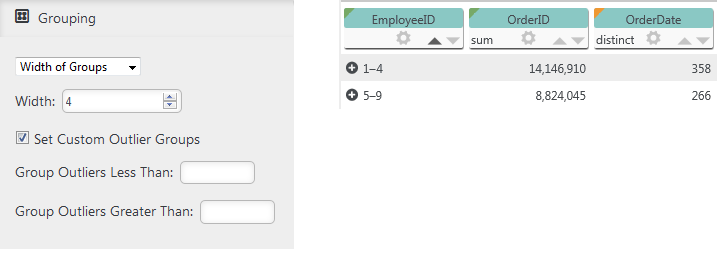
- Width of Groups - For Numeric data, this option allows you to define the "width" of your groups. The number you enter is always an approximate value, as the algorithm will try to create groups based on both the number of groups desired, the data distribution, and the precision of the data.
So, for example, if you want your groups to be four values wide but your data doesn't break up into that evenly, the result may "stretch" a group to include extra values. In the example above, a width of "4" was specified but the last group includes five values. You can usually get better grouping accuracy by creating "outlier" groups, which hold values outside ranges you specify. The grouped rows are retained and you can view them by clicking the "+" icon in the table.
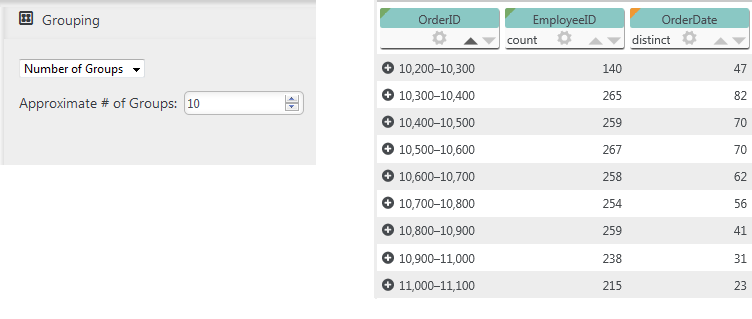
- Number of Groups - This option allows you to specify an approximate number of groupings. This will be an approximate
number because the Thinkspace may be required to create outliers or a number of
groups that break the data into human-friendly endpoints.
In the example shown above, the approximate number of groups was set to "10". In reality, this only produced nine data groupings. The grouped rows are retained and you can view them by clicking the "+" icon in the table.
- No Binning - This option disables the automatic binning features and simply creates a group for each distinct data value.
![]() The grouped rows are retained and you can view them by clicking the "+" icon in the table.
The grouped rows are retained and you can view them by clicking the "+" icon in the table.
Click Apply to group the data immediately. The sliding Enable/Disable switch can be used to turn Grouping on and off.