Using Widgets in Logi Info Apps
Now that we have a collection of visualization and dashboard widgets, it's time to use them an application. Let's start by using a visualization widget in a Log Info application, using these steps:
- Ensure that your application version is Logi Info v12.5+ and Discovery Module v3.0+ is installed, with an SSM 12.5 license.
- Ensure that you have a configured Connection.Logi Application Services element in your application's _Settings definition.
If its Logi Applicaton Service Authentication Type attribute is blank or configured for Standard authentication and the Username and Password attributes have valid values, there is no requirement for a Security element. However, if the authentication type is configured for TrustedAccess, then you must have a Security element in place to rovide user authentication.
- Add a SuperWidget element in an appropriate place in your Logi report definition, similar to the example above. If you can't find this element in Logi Studio, then you need to review Step #1. Configure the SuperWidget appropriately and click the browse button at the end of the Widget Config ID attribute value to display the SuperWidget Selector dialog box:
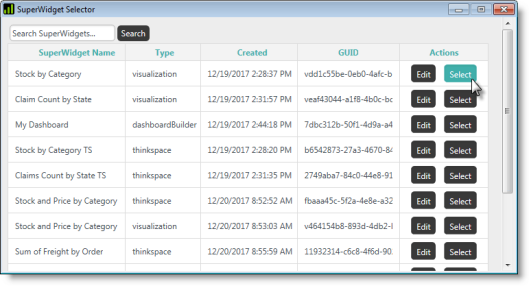
This dialog box contains an entry for every widget you built with the SuperWidget Authoring tool. Select the one you want to use in your report and the dialog box will close and the widget's GUID will be filled-in back in the attribute value.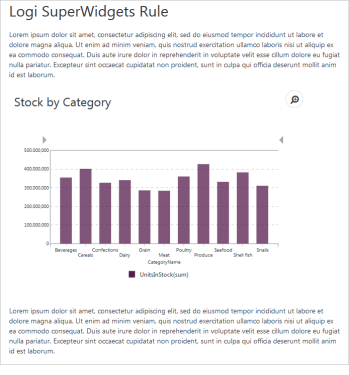
- Save and browse your report and, as in the example above, your visualization widget should be included. The widget is fully-functional, with live Explorer features, and is not embedded in an iFrame. That's all there is to it.
You should be aware that the widget is sensitive to the Logi Theme being used in your application and may display with different colors or fonts as a result.
Using SuperWidget Parameters
You can dynamically change many of the properties of the widget and change data filtering at runtime using parameters. First, let's see how we can use a parameter for a widget property:
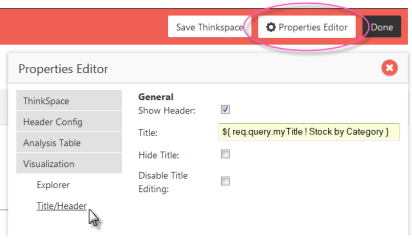
- In the widget editor, find the desired property (in this example, the Visualization Title) and enter a small piece of parameter "placeholder" code as its value, as shown above. The code format is:
${ req.query.<paramName> ! <defaultValue> }
Click Apply and Update to save your changes.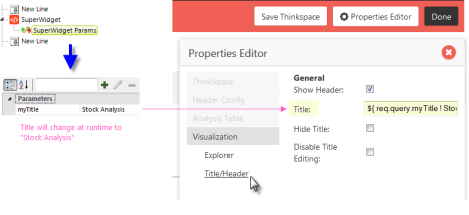
- Add a SuperWidget Params child element, shown above, to your definition and create a name-value pair for the parameter name identified in the code. Parameter values must be in the correct format for the property and may be tokens.
At runtime, the visualization's title will be the parameter value text. If there is no parameter value (for example, if a token is used for the value and it evaluates to nothing) then the default title value "Stock by Category" will be used.
Now let's see how we can use the same technique to create dynamic filters:
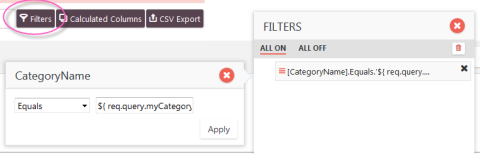
- In the widget editor, open the Filters panel and create a new filter for the data table by dragging-and-dropping the CategoryName column pill into it. As shown in the example above, we're going to create a filter that includes individual categories by name. In the filter definition panel, select the operator, Equals, and enter the same piece of code we used earlier as the comparison value:
${ req.query.myCategory ! * }
The code is slightly different in this context: instead of a "default value", we use an asterisk ("*") in the code to represent all values. This serves the same purpose by providing a guarantee that all values will be included if the parameter is empty.
Click Apply and Update to save your changes.

- Add a SuperWidget Params child element, shown above, to your definition and create a name-value pair that corresponds to the parameter name you used in the filter code. Parameter values must be in the correct format for the property and may be tokens.
At runtime, the visualization will be filtered to include only the CategoryName data identified in the parameter value, represented above by a token. If there is no parameter value then all CategoryName data will be included.
Adding a Visualization Widget with Thinkspace
Let's do that again but add one of our widgets that was saved with the Thinkspace controls. Go back to your report definition and open the SuperWidget Selector dialog box again. Select one of the widgets that included the Thinkspace, and you may need to make the SuperWidget element's Height and Width attributes more generous. Save your definition, and run the report.
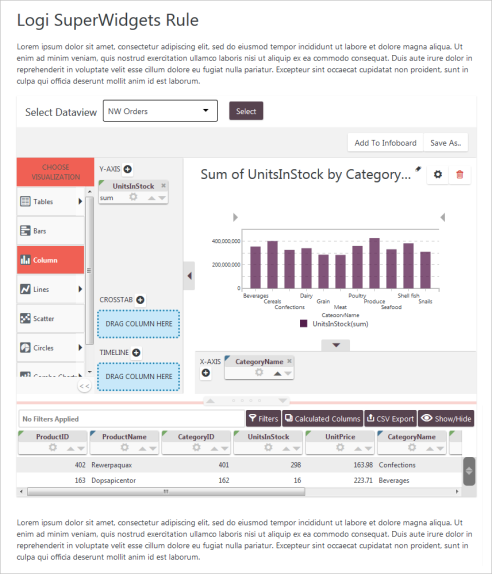
Now you should see your visualization inside a complete, working Thinkspace, as shown above, with "live" controls. Remember that the availability of that some of the features of the Thinkspace, including the Dataview selector and data table Filters, Calculated Columns buttons, etc. are configurable in the widget settings. You can use the Thinkspace controls now to change the visualization widget in many ways and then you can save your customized version as a new widget or add it to the Infoboard, using the buttons provided. However, you cannot update the underlying widget from here; it remains unchanged and usable again in its original form.
Adding a Dashboard Widget
And, finally, let's do that again with a Dashboard widget and, once again, you may need to make the SuperWidget element's Height and Width attributes more generous. Save your definition, and run the report.
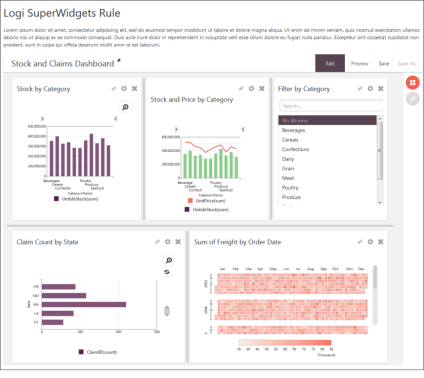
Now you should see your dashboard, as shown above, with "live" controls. Panels can be moved, filters changed, etc. at runtime.