Logi OLAP - Using the OLAP Grid
The following exercise will guide you through the steps of configuring the
grid dynamically. The instructions and screen shots that follow assume you
have made a connection to the AdventureWorks database but are applicable
for any data source.
- Preview or browse your OLAP Grid application.
-
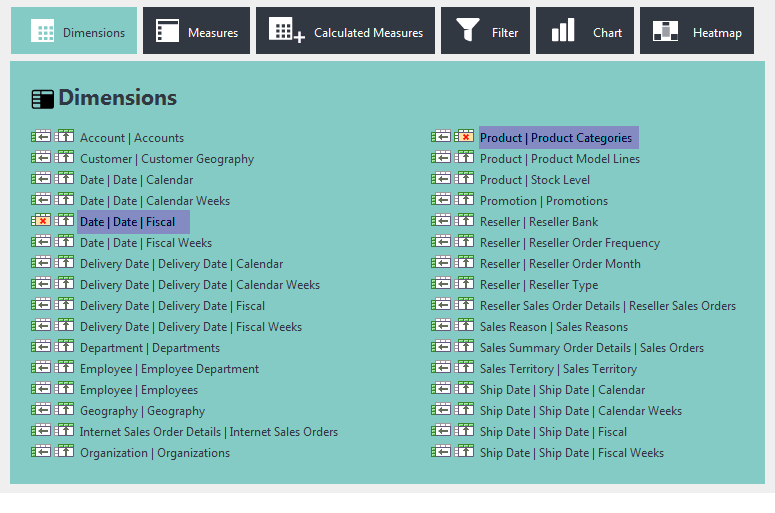
Click the Dimensions button at the top to open the
Dimensions panel, shown above. This is where users select
dimensions for the left and top axes of the grid. In the Dimensions
panel, select the data for Date Fiscal for the left axis and
Product Categories for the top axis, as shown above. Depending on
the grid's Batch Selection attribute setting, the changes will be
applied, and the table updated, automatically, or you may have to click
the Update Table button. You can click the Dimensions button again (or
another button) to hide the Dimensions panel.
-
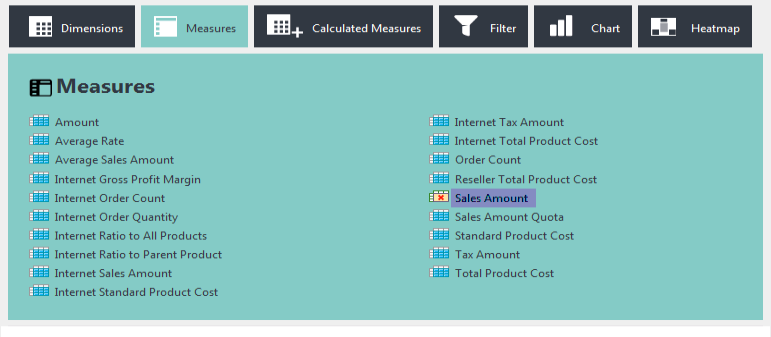
Click the Measures button to display the Measures panel, shown
above. Select the measures Sales Amount item, as shown
above. Click the Update Table button, if necessary. Click the Measures
button again to hide the panel.
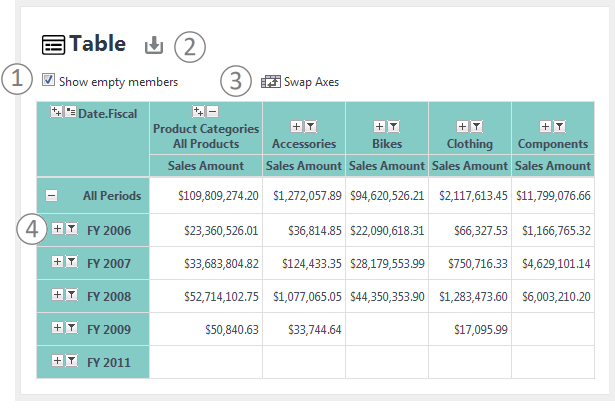 The resulting table should look something like the example shown above.
Note these features:
(1) Show or hide any empty members using this check box.
The resulting table should look something like the example shown above.
Note these features:
(1) Show or hide any empty members using this check box.(2) Click this icon to for Excel export, if the OLAP Grid element has been configured to display it.
(3) Click this icon to swap the axes to view the data in a different relationship.
(4) Click these member icons to drill-down or filter the data.
-
Click the Calculated Measures button to open the Calculated Measures
panel.
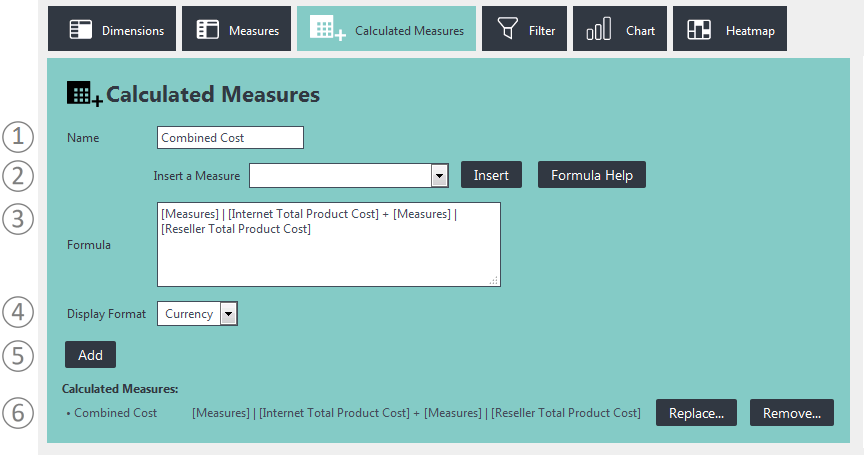
In the Calculated Measures panel, shown above, enter "Combined Cost" in the Name text box (1). Measures can be selected in the "Insert a Measure" select list (2) and added to the formula by clicking "Insert". The measures are inserted into the Formula text box (3), and/or you can type them in directly, to create a formula. Click the Formula Help button to view available functions and valid syntax. Then choose the Display Format (4) which can be Number, Percent, or Currency. When your formula is complete, click the Add button (5). The calculated measure will appear at the bottom of the panel (6) and it will appear immediately as a new column in your table. Click the calculated measure name (6) to place it back into the controls for editing, and click the Replace... or Remove... button to update or delete it. Click the Calculated Measures button again to hide the panel.

-
Now experiment with filtering the measures. Click the
Filter button to open its panel, shown above, where you can
filter your data by setting Include and
Exclude parameters. For example, you can limit your view of sales
data across regions of various departments to that which includes a
fiscal 2008 shipping date by setting an Include Filter, as follows:
Click the Ship Date.Fiscal measure (1) and, after a moment, the filter selector area will appear on the right. Click the "I" icon, for Include, adjacent to the FY 2008 item (2). This will add the filter into the "Selected Filters" area (3), which lets you see what filters are in effect and where you can also delete a filter. The table automatically updates to reflect the filters chosen. There's also an "E" icon, for Exclude, in the
filter selector area.
Click the Filter button to hide the panel.
-
Charts and Heatmaps, based on all of the current table
data, are initially displayed just by clicking the Chart and
Heatmap buttons to open their respective panels:
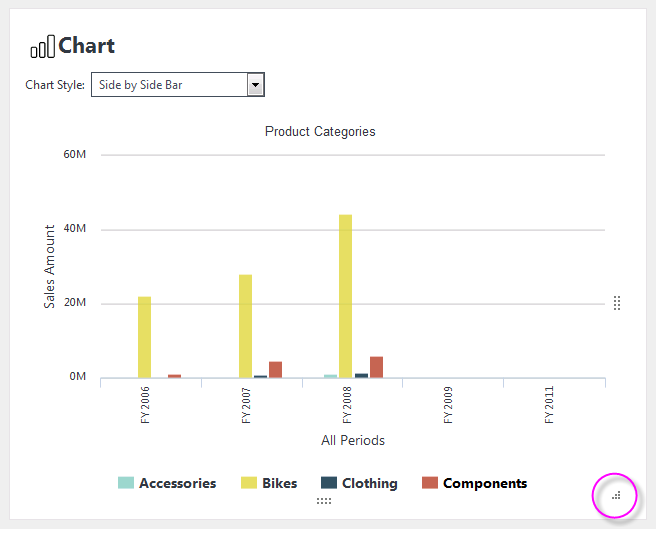
Once they're displayed, charts can be customized by changing their Chart Style, and by using their re-sizing handles (circled above) which may not be visible until the mouse cursor hovers over them. A variety of chart styles (Stacked, Line, Spline, etc.) are available using the selection list and charts and heatmaps can be drilled down into through all grid layers.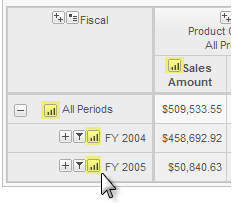
In addition, once the chart or heatmap has been displayed, additional small icons appear in each row and column in the table, as shown above; these allow you to pick which measure and dimension layer to chart.
That concludes this exercise in configuring an OLAP grid at runtime.