Aggregating Grouped Data
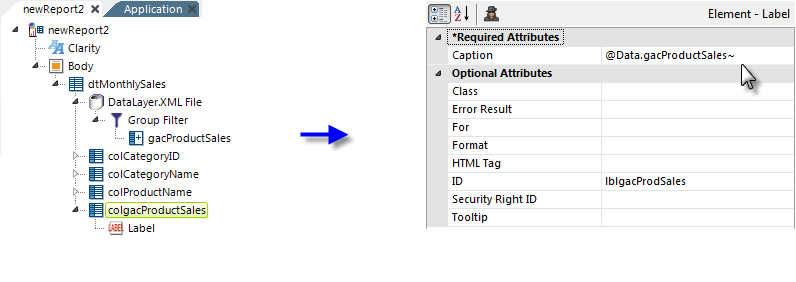
A very common requirement when grouping data is to perform some kind of aggregation, such as summing or counting, of the grouped values. The Group Aggregate Column element gives you the ability to generate this summary data for each grouped column in the datalayer. The following example builds on the earlier example in Grouping for Unique Rows, creating a total product sales value for each product category. For simplicity, the necessary Data Table Column elements are not shown.

- As shown above, a Group Aggregate Column element is added to the earlier example.
- Its Aggregate Column attribute value is set to the name of the column that we want to aggregate.
- Its Aggregate Function attribute value is set to Sum. Other options include Average, Concat, Count, DistinctCount, Max, Median, Min, Mode, and Stdev.
Aggregations exclude columns with Null values by default. If you want to include them create a constant, rdCalculationsIncludeNulls, in your _Settings definition and set its value to True. - Its ID attribute specifies the name of a new column that will be added to the datalayer, containing the summarized data values.
- Its Data Type attribute specifies the data type of the column named in the Aggregate Column attribute.

The data in the new column in the datalayer is available at runtime like any other, as shown above, through the use of an @Data token.

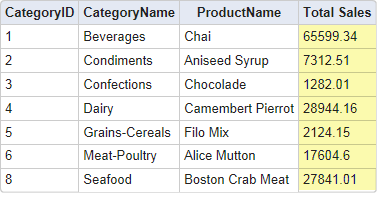
And the resulting output is shown above, in a new column given the header caption "Total Sales". All records have been grouped by CategoryID, only the first record for each group has been retained, and ProductSales values for each group have been summed and are now available in the new column.