Create a SuperWidget
![]() SuperWidgets have been deprecated in Logi Info v12.6.
Now you're ready to build a visualization using the Dataview you just created.
SuperWidgets have been deprecated in Logi Info v12.6.
Now you're ready to build a visualization using the Dataview you just created.
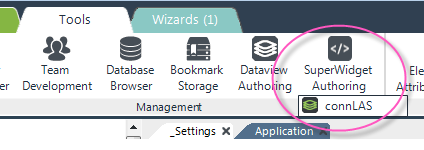
On Studio's Tools tab, you'll find the SuperWidget Authoringmenu item, circled above. As before, click it once to display the list of connections, then click the "connLAS" connection in the list. The tool will open a Login page in your default browser. Enter the "admin" user name and the password you supplied when configuring the Connection.Logi Application Service element. Click Login to access the tool.
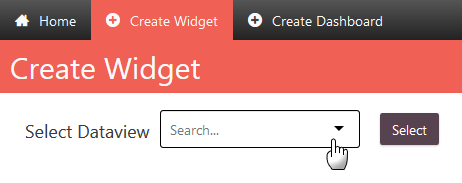
You'll see the Widgets Home page. Click the Create Widget tab, shown above. Select a Dataview from the list and click Select.
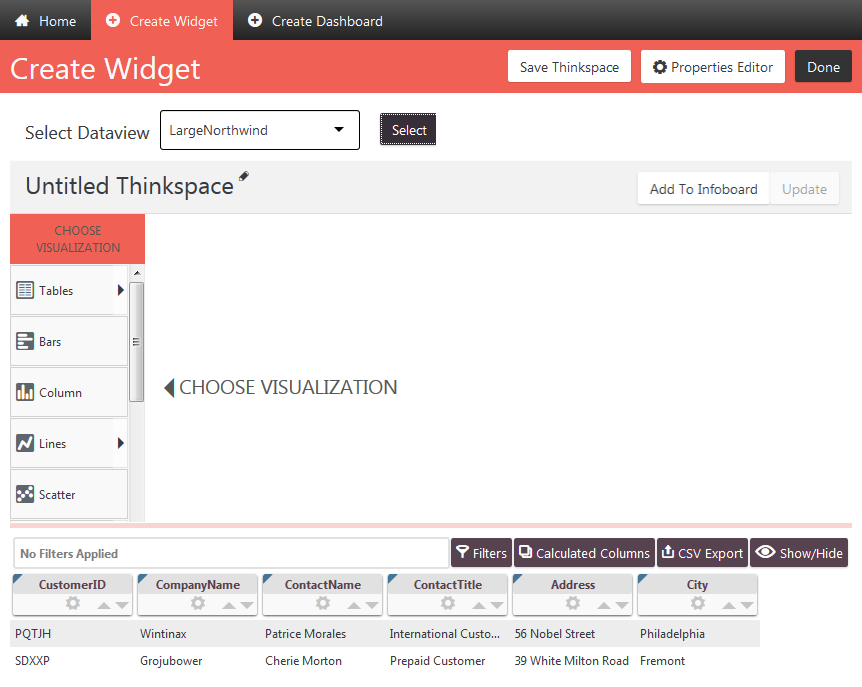
The Thinkspace tool will open, with the data from the Dataview you
selected, as shown above. Detailed instructions for using the Thinkspace
can be found in Use the Thinkspace
- 3.x. For this exercise, create a quick little visualization by clicking dragging a data table column pill...

... and dropping it onto another pill, as shown above. The Thinkspace will create a visualization based on the data.
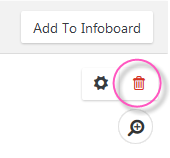
If you really dislike the visualization and want to try dragging and dropping other columns, click the Trashcan icon in the upper-right corner of the visualization to delete it and start over.
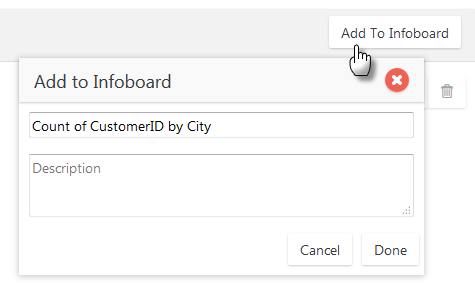
When you're ready, click Add to Infoboard, as shown above, then accept the suggested title or provide your own, and click Done.
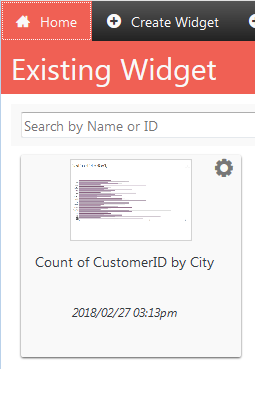
You'll be returned to the Home page and you should see a pill representing your widget, as shown above. This widget can be used multiple times in different applications.