Java Plug-in - Debugging Example: Eclipse and Tomcat
You can debug your plug-in as it runs in your Logi app. Due to the variety of Java tools and web servers available, it's not possible to provide comprehensive debugging guidance here. However, the following example, using the Eclipse IDE and the Apache Tomcat web server should be helpful.
Generally speaking, Java application servers support a Debug mode, which can be enabled when starting the application server. This creates a debugging server, which is typically available on port 8000. You connect your Eclipse project to this port to start debugging your application.
If you're developing and testing on your desktop platform, to enable Debug mode navigate to the {catalina_home}/bin folder and execute the following commands:
- set JPDA_ADDRESS=8000
set JPDA_TRANSPORT=dt_socket
catalina.bat jpda start
If Tomcat is on a remote machine, you may instead add this to your JAVA_OPTS:
- -Xdebug -Xrunjdwp:transport=dt_socket,address=8000,server=y,suspend=n
Tomcat should start, with its secondary debugging server running. If you have difficulty with this, consult your web server documentation.

Next, in Eclipse, open your plug-in project, and then click the little options arrow beside the Debug icon on the toolbar, as shown above. Select the Debug Configurations... option in the pop-up menu that appears.

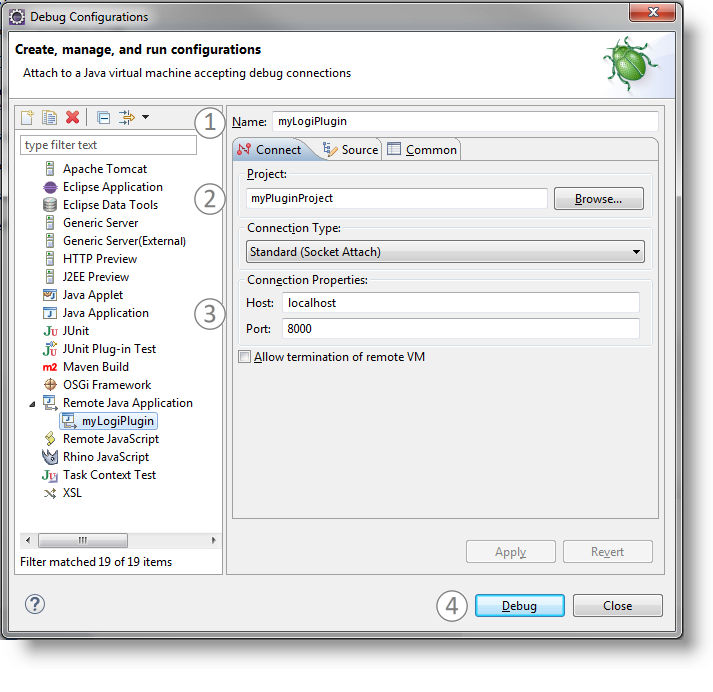
Double-click the Remote Java Application item in the left menu to create a new debug profile, as shown above. Then,
- Provide an arbitrary profile Name.
- Browse for and select your plug-in Project.
- Ensure that the Connection Properties are correct. The Host is the base address of your Tomcat server; if it's running on your development machine, then it will be localhost. The Port is the one configured when starting Tomcat (default: 8000).
- Click Debug to begin your debugging session.
Eclipse will now connect to the debugging server loaded in Tomcat and is then ready for you to browse your Logi application. Interacting with your Logi app will eventually run your plug-in; proper debugging can begin in Eclipse at that point, with the use of watches, breakpoints, etc. These techniques are beyond the scope of this topic; see your Eclipse User Guide for more information.

To end your debugging session, click the Disconnect icon in the Debug view toolbar, as shown above.
![]() If you haven't done so already, you should read Logi Plug-ins for important supporting information before proceeding.
If you're developing a .NET plug-in, see Create .NET Plug-in instead of this one.
If you haven't done so already, you should read Logi Plug-ins for important supporting information before proceeding.
If you're developing a .NET plug-in, see Create .NET Plug-in instead of this one.