Creating Real Time Charts
A real time chart can be updated automatically at runtime by using data that changes rapidly with time such as stock market quotes. After you create a real time chart, when the data in the data source the chart uses is updated in real time, the chart will automatically fetch data from the data source to update itself with the interval you specify. Then, you will conveniently see the real time data information without updating the chart by yourself and without having to re-fetch all of the data. Only the new data since the last interval is selected by the query.
Before you create a real time chart, you have to make sure the data source you use contains real time data which can be updated periodically. Otherwise the chart will lose its real time functionality.
Real time charts can only be of the Bar, Bench, Line and Area types and are supported in web reports and library components only.
To create a real time chart in a web report or a library component:
- Position the mouse pointer at the destination in the report where you want to insert the chart.
- Do either of the following:
- Drag a chart button from the Visual category of the Components panel to the destination.
- Select Insert > Chart or Home > Insert > Chart.
The Create Chart wizard appears, which contains a set of screens for helping you define a chart easily. You can use the Back and Next buttons or select the screen name on the screen navigation bar to switch between the screens.
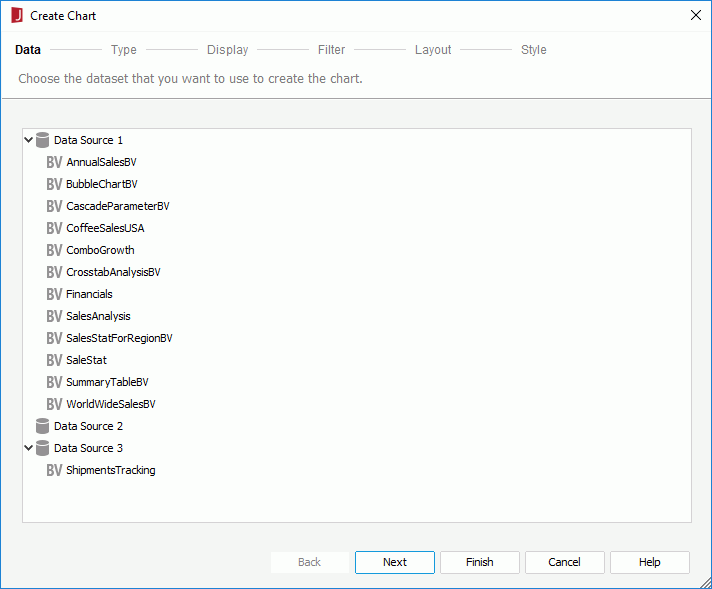
- In the Data screen, select a business view in the current catalog using which to create the chart.
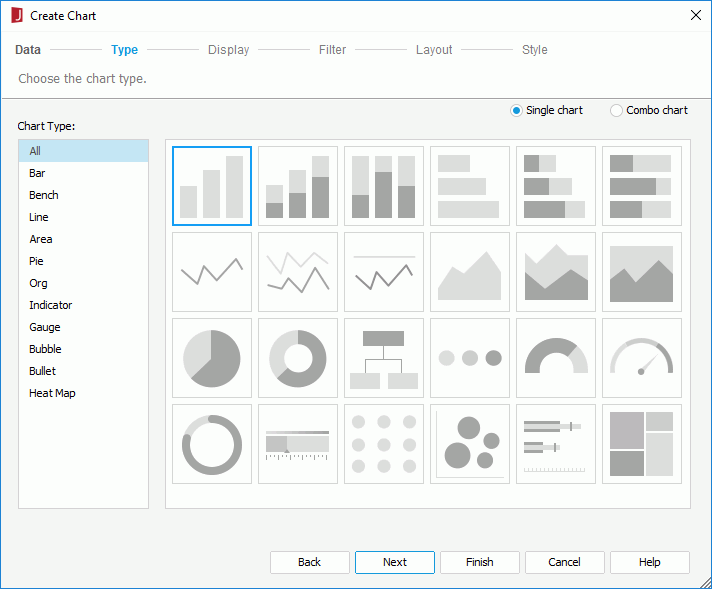
- In the Type screen, specify the type of the chart which can only be single chart of the Bar, Bench, Line, or Area type.
- In the Display screen, specify a title for the chart in the Title text box. Check the Real Time checkbox.
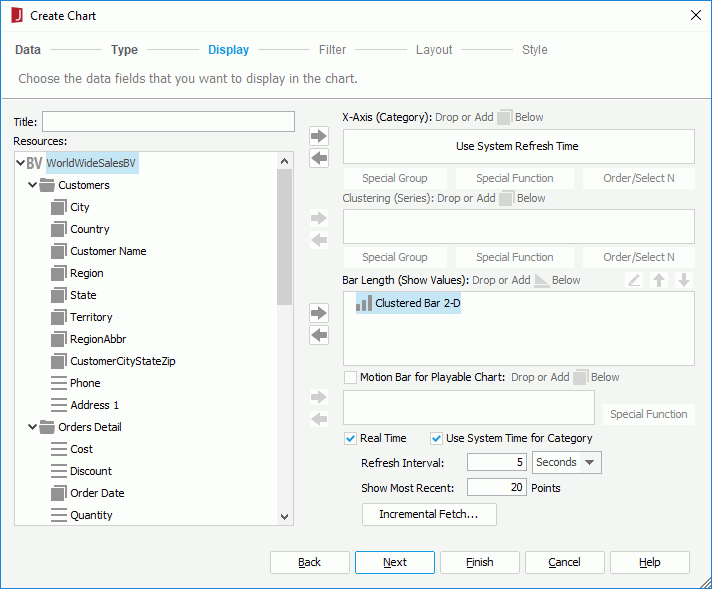
- By default, Use System Time for Category is checked and you can see the text Use System Refresh Time is displayed in the Category box, which means the time at which the chart refreshes itself will be used as the category value. You can uncheck Use System Time for Category and choose a group object
 or detail object
  in the specified business view, or a dynamic formula used as Group
  or dynamic formula used as Detail
  created for the business view in the current report to display on the category axis, and define the Order/Select N condition on it if required.
 - In the Show Values box, add the group objects and detail objects that are of Numeric type to display on the value axis.
Only group objects and details objects of Numeric type are supported on the value axis of a real time chart. If you add objects of other types to the Show Values box, you will find that the Real Time checkbox is automatically unchecked.
- Specify the time interval at which the chart will get data and refresh itself automatically in the Refresh Interval text box.
- Specify the most recent N records to be kept for the real time data on the chart in the Show Most Recent text box.
- Select the Incremental Fetch button to add the fields you want to use as the unique key of the real time chart in the Unique Key dialog, which is used to guarantee there are no two records with the same unique key value in the chart.
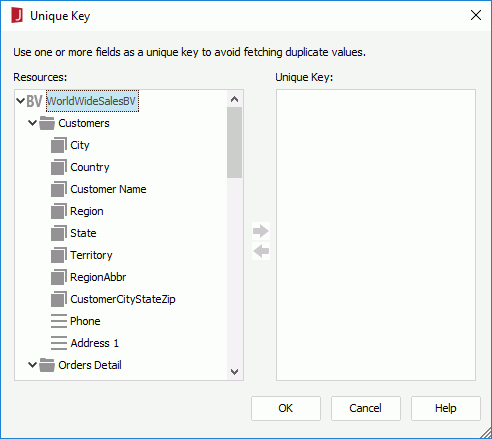
Once a unique key is defined, each time when the chart automatically updates itself, the data that has the same unique key value as the previously loaded data records will be filtered and only data with different unique key value will be added to the chart. For instance, if you add the fields Country and Product ID as the unique key of a real time chart, when a record with the product ID 1 in USA has already been loaded into the chart, no more records of this product ID in USA will be added to the real time chart because they have the same unique key value. The most common usage is with a time field so when a time is part of the unique key the data in the chart will be updated each time new records are added to the database with more recent times.
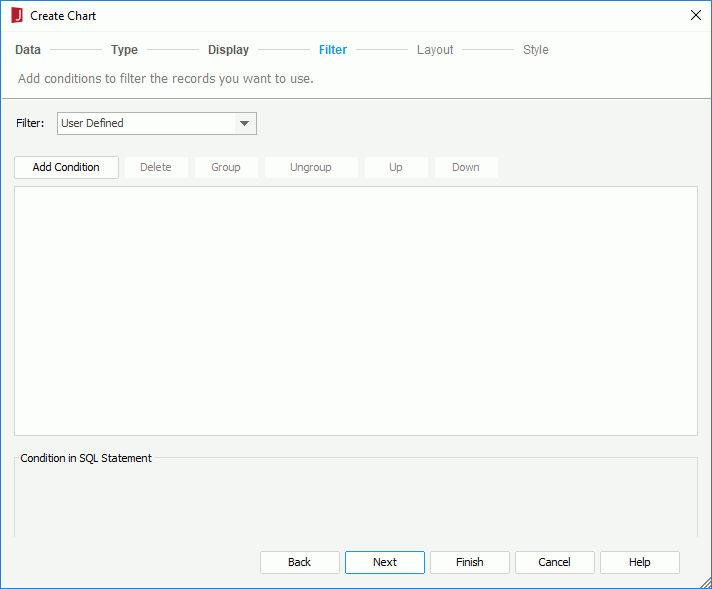
- In the Filter screen, apply a filter to reduce the data displayed in the chart. You can select a predefined filter of the specified business view from the Filter drop-down list to apply, or select User Defined in the list to define a new filter as required.
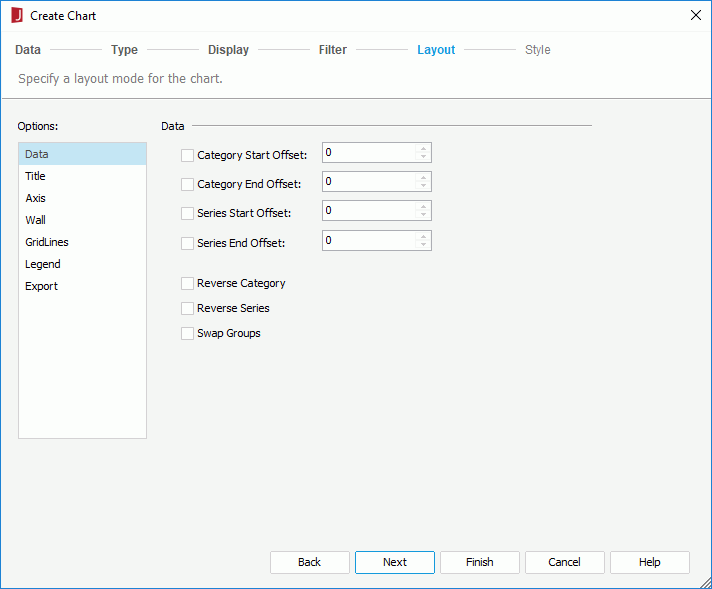
- In the Layout screen, specify the layout of the chart.
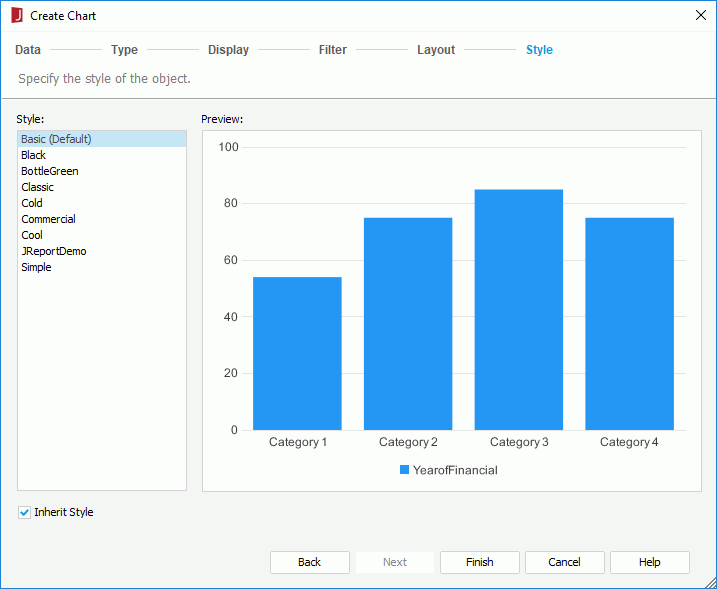
- In the Style screen, select a style for the chart.
- Select Finish to create the chart.
 Previous Topic