Formatting the Rectangles and Rectangle Titles in a Heat Map
This topic introduces how to format the rectangles and titles for rectangles in a heat map.
Below is a list of the sections covered in this topic:
Formatting the Rectangles in a Heat Map
- When there is only one group in the heat map, right-click on the heat map and select Format Rectangle from the shortcut menu to bring up the Format Rectangle dialog.
When there are two or more groups in the heat map, right-click on the heat map, then from the Format Rectangle submenu, select a desired group field to bring up the Format Rectangle dialog for the field.
- In the Fill tab, specify the fill color of the rectangles: Use Single Color, or Use Single Color with Condition.
If you select Use Single Color:
- When the heat map is colored by one of the following cases: no field, 1 to n groups, 1 to n groups and 1 summary
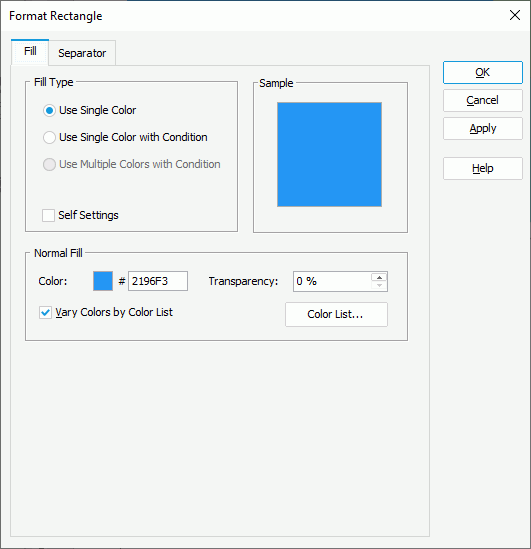
First make a choice for the Self Settings checkbox: when Self Settings is unchecked, the color pattern specified here will be synchronized to the Pattern List property on the chart object in the Report Inspector, which can also be applied by data markers of other subtypes if the chart is a combo chart; when Self Settings is checked, it indicates the color pattern is private to the current data markers themselves (the rectangles in this case), which can be remembered and applied to the data markers of a new type automatically if later you change the type of the chart. Then specify the color for the first rectangle (when colored by no field, all rectangles are filled with this color) and the transparency of the color schema to fill the rectangle (to change the color, select the color indicator and select a color from the color palette or input the hexadecimal value of a color directly in the text box). By default Vary Colors by Color List is checked which means each rectangle is filled with a different color, and you can select the Color List button to customize the color of each rectangle in the Color List dialog as you want.
- When the heat map is colored by a summary
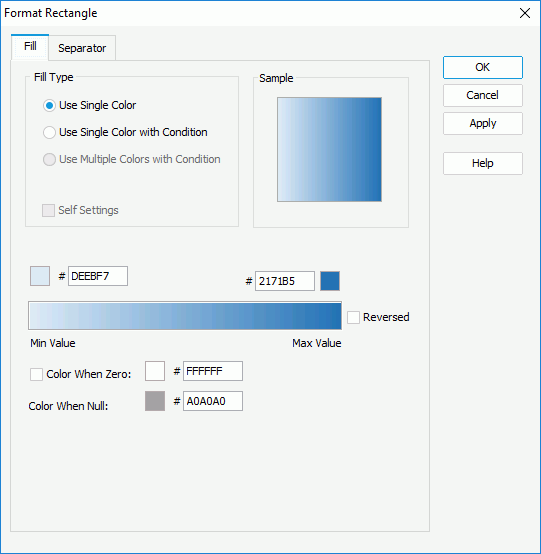
Specify the start color for the minimum value and the end color for the maximum value of the summary respectively on the gradient color bar. To exchange the start color and the end color, check Reversed (by default the option is unchecked and the start/end color here corresponds to the start/end color on the chart object in the Report Inspector; when it is checked, the start/end color here corresponds to the end/start color on the chart object). If you want to specify a color for the zero value, check Color When Zero and define the color accordingly, then the gradient color will change from the start color to the zero value color, and then from the zero value color to the end color. You can also specify a color for the null values.
If you select Use Single Color with Condition to fill the rectangles, specify the conditions and the color pattern bound with each condition respectively. For details, refer to Adding Conditional Color Fills to Charts.
- When the heat map is colored by one of the following cases: no field, 1 to n groups, 1 to n groups and 1 summary
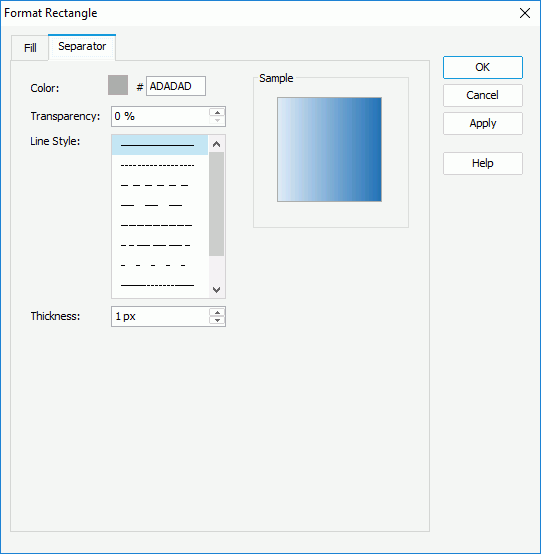
- In the Separator tab, specify the color, transparency, line style and thickness of the lines separating the rectangles. Note that you will get a bad layout in the preview result in Logi JReport Designer and in the exported result when the separator thickness is set to a big value.
- For a heat map chart in a library component, you can define web behaviors on the rectangles in the Behaviors tab.
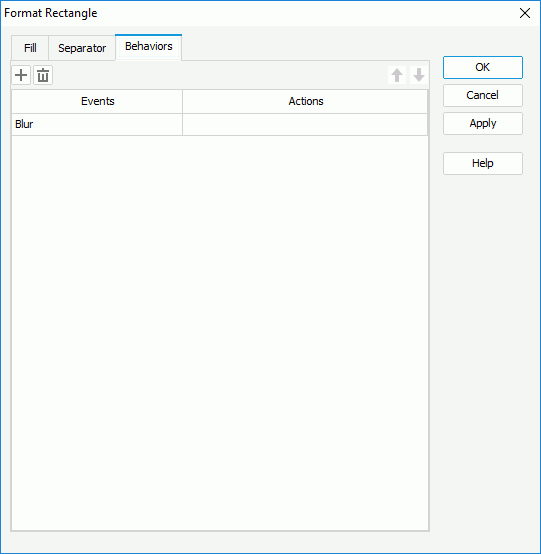
Select a trigger event from the drop-down list in the Events column, then select in the Actions column and select
 that appears in the text box. In the Web Action List dialog, bind a web action to the rectangles the same as you do to web controls in the library component, which will be triggered when the specified event occurs on the rectangles. The web actions you can bind include Parameter, Filter, Sort, Change Property and Send Message.
To add more web behaviors, select
 and define them as required; if a web behavior is not required, select it and select
  . Select
  or
or  to adjust the order of the behaviors, then at runtime when an event that has been bound with more than one action happens, the upper action will be triggered first.
 - Select OK to accept the changes and close the dialog.
Formatting the Titles for Rectangles in a Heat Map
- When there is only one group in the heat map, right-click on the heat map and select Format Rectangle Title from the shortcut menu to bring up the Format Rectangle Title dialog.
When there are two or more groups in the heat map, right-click on the heat map, then from the Format Rectangle Title submenu, select a desired group to bring up the Format Rectangle Title dialog for the group.
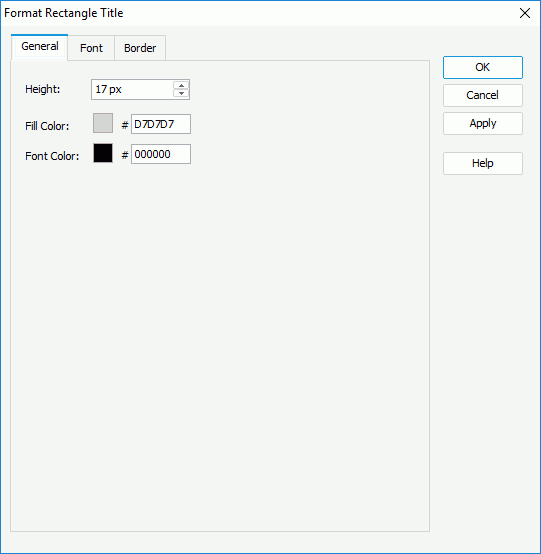
- In the General tab, specify the height, fill color, and font color of the rectangle titles (to change a color, select the color indicator and select a color from the color palette or input the hexadecimal value of a color directly in the text box).
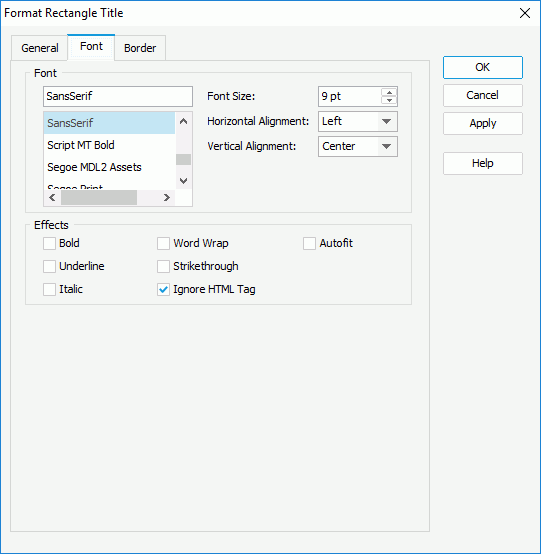
- In the Font tab, set the font settings for the titles.
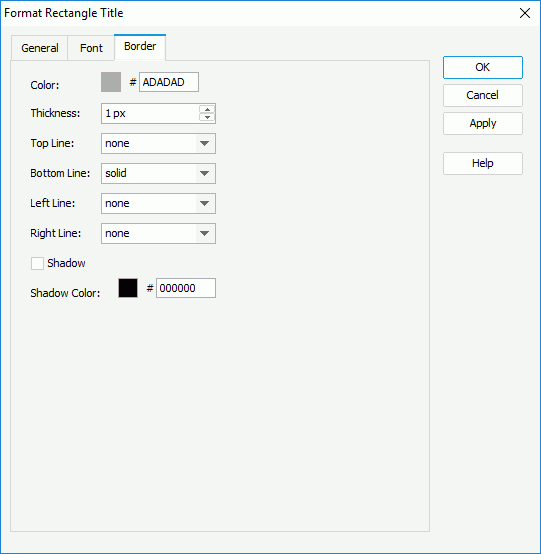
- In the Border tab, set the border color, thickness, line styles, and whether the borders have shadow effect and the shadow color if yes.
- Select OK to accept the changes and close the dialog.
 Previous Topic