Format Pie Dialog Box Properties
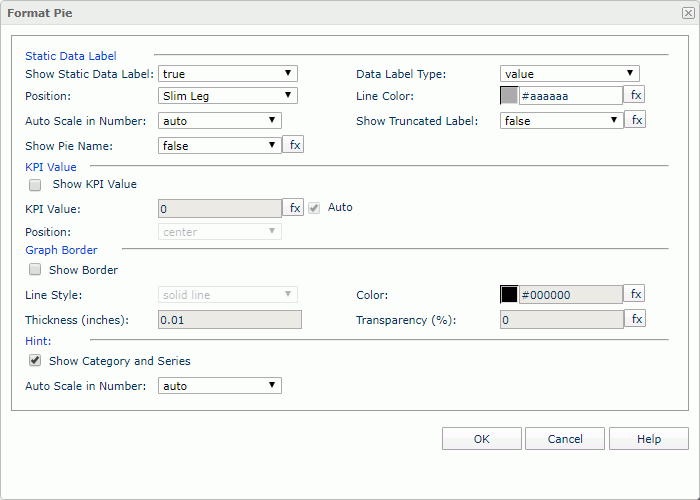
You can use the Format Pie dialog box to format the pies of a pie chart. This topic describes the options in the dialog box.

Static Data Label
Specifies the properties of the static data labels on the pies.
- Show Static Data Label
Specifies whether to show the static data labels on the pies. Only when it is true can the following static data label related properties work. - Data Label Type
Specifies in which way to display the data values in the static data labels.- category name
Shows the category name for each pie section. - category name, percent
Shows the category name and percentage for each pie section. - category name, value
Shows the category name and value for each pie section. - category name, value, percent
Shows the category name, value, and percentage for each pie section. - percent
Shows the percentage of each pie section to the total. - value
Shows the value for each pie section. - value and percent
Shows the value and the percentage for each pie section.
- category name
- Position
Specifies the position of the static data labels on the pies.- Autofit
If selected, the static data labels will be displayed automatically. - Sticker
If selected, the static data labels will be displayed beside the pie sections. - Slim Leg
If selected, the static data labels will be displayed beside the pie sections and pointed by thin lines.- Line Color
Specifies the color of the thin lines that are used to point to the static data labels.
- Line Color
- Best Fit
If selected, the static data labels will be displayed at the best fit position automatically. - On Slices
If selected, the static data labels will be displayed on the pie sections (slices).
- Autofit
- Auto Scale in Number
Specifies whether to automatically scale the values that are of the Number data type when the values fall into the two ranges:
- When 1000 <= value < 10^15, Logi Report uses the following quantity unit symbols of the International System of Units to scale the values: K (10^3), M (10^6), G (10^9), and T (10^12).
- When 0 < value < 0.001 or value >= 10^15, Logi Report uses scientific notation to scale the values.
The default value auto means that the setting follows that of the chart platform.
Show Truncated Label
Select this option to truncate labels that would go beyond the boundaries on a pie chart paper instead of them being hidden altogether - the default behavior. Logi Report displays an ellipsis (…) from the right side of the label, along with part of the name instead of the entire name, when you select this option. The truncated labels are also affected if you select the Position option of Best Fit (as seen above); where the label is cut off from the left or the right depending on the position of the label.- Show Pie Name
Specifies whether to show the names of the pies.
KPI Value
Specifies the properties for the KPI values of the pies.
- Show KPI Value
Specifies whether to show KPI value for each pie.- KPI Value
Specifies the KPI value to display on each pie. By default, the total value of each pie will be used as the KPI value. If you want to customize the value, clear Auto and type a value in the text box, or select and select a formula or summary from the drop-down list to use its value as the KPI value.
 - Position
Specifies the position of the KPI value at the center, top, bottom of each pie or customized which enables setting the X and Y properties to change the position.
- KPI Value
Graph Border
Specifies the properties for the border of the pies.
- Show Border
Specifies whether to show the border of the pies. When it is selected, the other border properties will be enabled.- Line Style
Specifies the line style to apply to the border. - Color
Specifies the color of the border. - Thickness
Specifies the thickness of the border. - Transparency
Specifies the transparency for color of the border.
- Line Style
Hint
Specifies the data marker hint properties.
- Show Category and Series
Specifies whether to include the category and series values in the data marker hint. - Auto Scale in Number
Specifies whether to automatically scale the values that are of the Number data type when the values fall into the two ranges:
- When 1000 <= value < 10^15, Logi Report uses the following quantity unit symbols of the International System of Units to scale the values: K (10^3), M (10^6), G (10^9), and T (10^12).
- When 0 < value < 0.001 or value >= 10^15, Logi Report uses scientific notation to scale the values.
The default value auto means that the setting follows that of the chart platform.
OK
Applies the changes and closes the dialog box.
Cancel
Does not retain any changes and closes the dialog box.
Help
Displays the help document about this feature.
 Previous Topic