Creating a Compound Crosstab
By putting multiple compound row groups and column groups together and defining summaries for every combination of a compound row group and column group, a compound crosstab is created. Compound crosstabs make far more sophisticated crosstab analysis possible.
Currently compound crosstabs are only supported in page reports that are created using query resources.
The following presents a compound crosstab example for you to get more about the feature.
- Open the catalog file SampleReports.cat in
<install_root>\Demo\Reports\SampleReports. - Select File > New > Page Report.
- In the Select Component for Page Report dialog, select Crosstab and select OK. The Crosstab Wizard appears.
- In the Data screen, select the query WorldWideSales in Data Source 1 of the catalog.
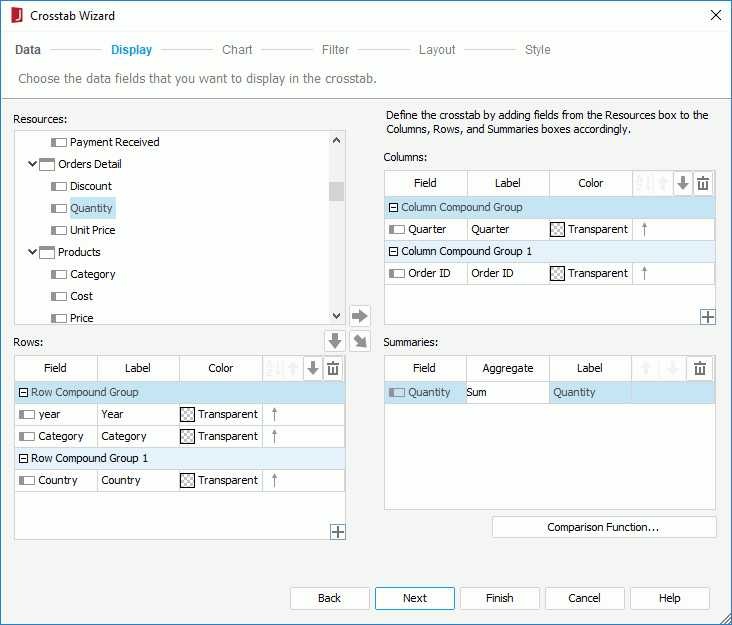
- In the Display screen, select
 in the Rows box and two compound row groups appear in the box.
 - Select Row Compound Group, drag and drop the formula year and the field Category in the Products table from the Resources box to the row group one by one.
- Select Row Compound Group 1 and add the field Country in the Customers table to it.
- Select
 in the Columns box to add two compound column groups, then add the formula Quarter to Column Compound Group and the field Order ID in the Orders table to Column Compound Group 1.
 - Select Row Compound Group in the Rows box and Column Compound Group in the Columns box, drag and drop the field Quantity in the Orders Detail table from the Resources box to the Summaries box, and specify the aggregate function as Sum.
- Repeat the above step to add the following fields with the specified aggregate functions for the combinations of the following compound groups:
- Row Compound Group and Column Compound Group 1: Price, Average
- Row Compound Group 1 and Column Compound Group: Cost, Sum
- Row Compound Group 1 and Column Compound Group 1: Unit Price, Average
- Use the field names for all fields except the formula field year to label the rows, columns and summaries. For the formula field year double-click in the Label column and input Year.

- Switch to the Filter screen and specify the filter condition as Category in Blends,Bold And Country in Australia,Belgium. Select Finish.
- In the Report Inspector, select Label, Label 1, QUARTER, Label 4, Label 5, YEAR, Label 6, Label 7, CATEGORY, Label 10, Label 11, Label 12, QUANTITY, QUANTITY 1, QUANTITY 2, QUANTITY 3, QUANTITY 4 and QUANTITY 5 at the same time by pressing the Ctrl key on the keyboard, specify the Background property to Lightgray.
- Repeat the above step to specify the Background property of Label 2, Label 3, Order ID, Label 15, Label 16, Label 17, PRICE, PRICE 1, PRICE 2, PRICE 3, PRICE 4 and PRICE 5 to Pink, specify the Background property of Label 8, Label 9, COUNTRY, Label 13, Label 14, COST, COST 1, COST 2 and COST 3 to Orange, specify the Background property of Label 18, Label 19, UNIT PRICE, UNIT PRICE 1, UNIT PRICE 2 and UNIT PRICE 3 to Gray.
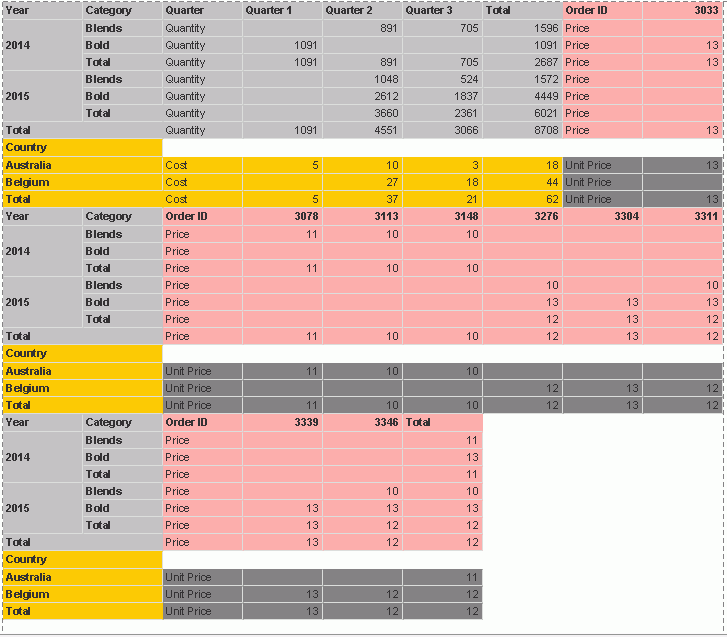
- Save the report and preview it. You can see the crosstab is composed of four parts, showing different summary information for different combinations of row compound groups and column compound groups.

 Previous Topic