Stacked Bars, Repeat Elements and their data source

Good morning,
I have a requirement to create a stacked bar chart that is able to work from a data source where the number of series is unknown until the data is returned.
So far, easy to implement by using a Repeat element under the Chart.Canvas. My issue is with the datasource. As I can't use a DataLayer.Linked (I think Logi used to allow the element to be added, but whether it worked...?) I appear to have to request the data once to get the Repeat data source for the list of series, then an unknown number of times to get the data for each stacked bar. Essentially i'm calling the same query again and again, and its so slow when querying the DB.
Is there anyway I can reduce the number of round trips to the DB Server?
Kind Regards
Martin
-

Hey Martin,
Do you have a reproducer you can post to demo this issue with an XML datalayer? That would go a long way in trying to help you shape this. Other than that, there are some interesting examples here - https://devnet.logianalytics.com/hc/en-us/articles/4419723219991-Repeat-Elements, including the statement that Repeat Elements cannot be used with DataLayer.Linked, which I recall being a restriction back to v11.
Specifically, the example here - https://devnet.logianalytics.com/hc/en-us/articles/4419707894935-Repeat-Elements-Example-Dynamic-Data-Table-Columns#DTColumns indicates the use of concatenation of rdCrosstab required within your DataLayer to map to multiple values. Since I am using Crosstab Filters for my Stacked Bar Charts, this is where I would start to figure out how to accomplish this dynamically within a single query.
If this doesn't work for you, try to generate some sample XML data and a reproducer and post here. You should be able to get direct help most quickly that way. I find that I often solve my own problems by creating the reproducer as it removes all of the clutter and gets right to the issue.
Regards,
Johnny1 -
Odd - i've replied to this but my comment has been stuck at Pending approval for four hours...will it be the code block I have in it?
0 -

Based on Martin's original description you could achieve this with a crosstab filter.
<ChartCanvas ID="cc2">
  <DataLayer Type="Static">
    <StaticDataRow Category="Category1" Series="Series1" Value1="12" />
    <StaticDataRow Category="Category2" Series="Series2" Value1="33" />
    <StaticDataRow Category="Category3" Series="Series1" Value1="12" />
    <StaticDataRow Category="Category3" Series="Series2" Value1="33" />
    <StaticDataRow Category="Category1" Series="Series3" Value1="33" />
    <StaticDataRow Category="Category2" Series="Series1" Value1="32" />
    <CrosstabFilter CrosstabColumn="Series" CrosstabLabelColumn="Category" CrosstabValueColumn="Value1" CrosstabValueFunction="Sum" />
  </DataLayer>
  <Series ChartXDataColumn="Category" ChartXDataColumnType="Text" ChartYDataColumn="rdCrosstabValue" StackGroupName="@Data.Series~" Type="Bar" BarStacking="Stacked" />
  <ChartXAxis AxisType="Category" />
</ChartCanvas>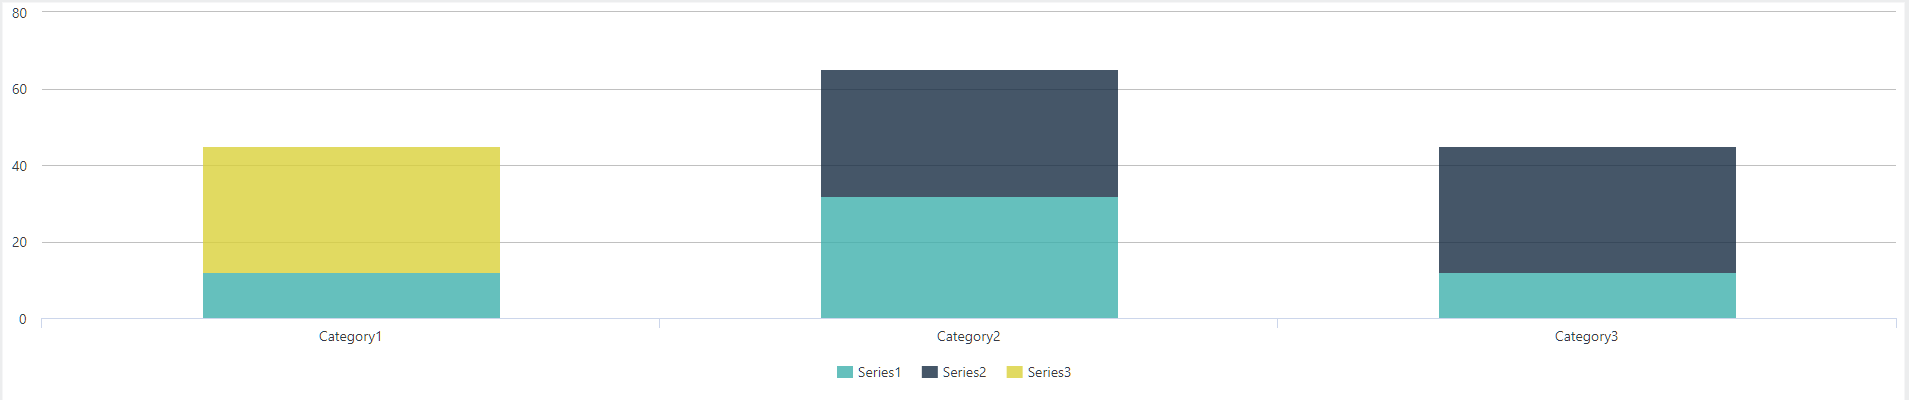
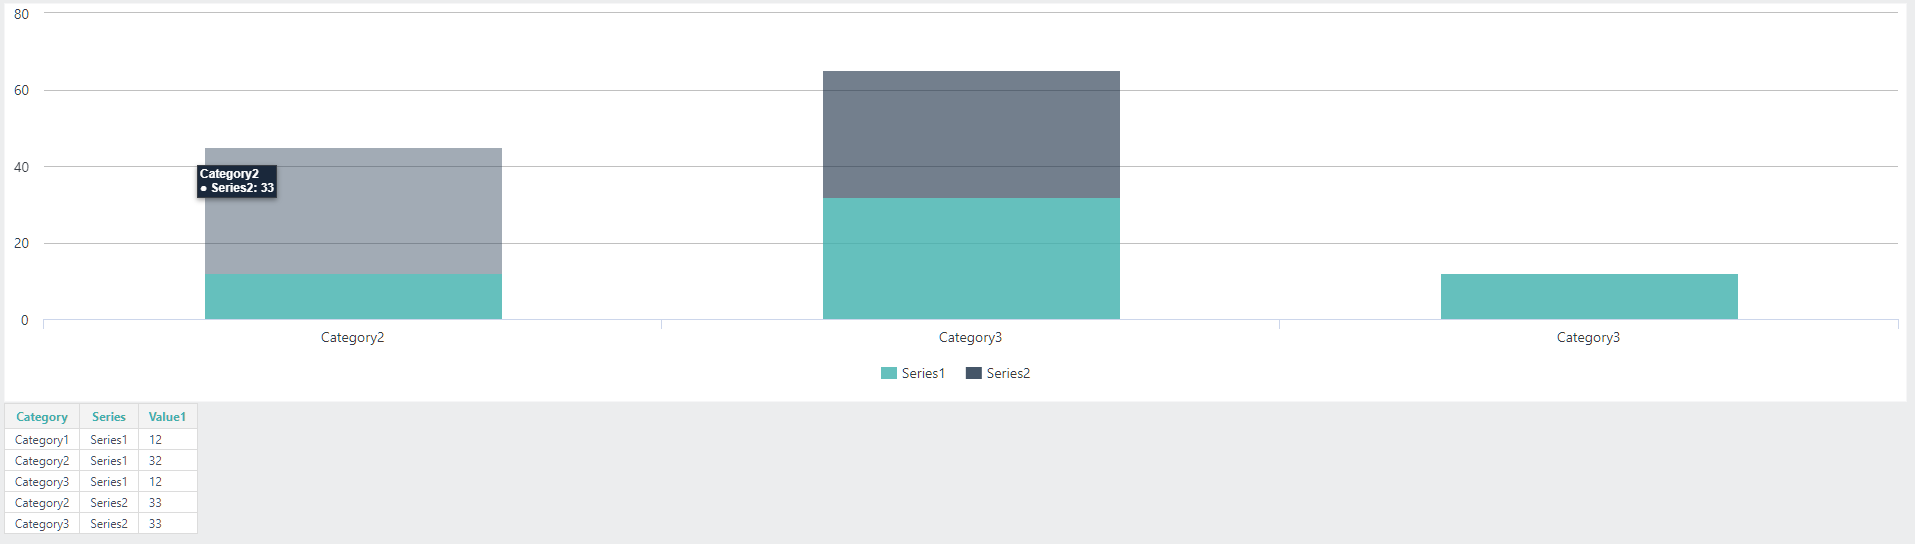
This can also be accomplished via a Repeat element, however, the data provided for each series will have to accommodate each Category (even if the value is blank for that category), this is due to how Logi assigns Categorical X-Axis positions. I don't think you will have this issue if the X-Axis is date-time based.
In the below code, you will see some static rows remarked out. This would simulate not sending all Categories within the datastream for all Series<ChartCanvas ID="cc1">
<RepeatElements ID="rep">
<DataLayer Type="Static">
<StaticDataRow Category="Category1" Series="Series1" Value1="12" />
<StaticDataRow Category="Category2" Series="Series1" Value1="32" />
<StaticDataRow Category="Category3" Series="Series1" Value1="12" />
<Remark>
<StaticDataRow Category="Category1" Series="Series2" Value1="">
<Note Note="zero value for Series2 Category1" />
</StaticDataRow>
</Remark>
<StaticDataRow Category="Category2" Series="Series2" Value1="33" />
<StaticDataRow Category="Category3" Series="Series2" Value1="33" />
<Remark>
<StaticDataRow Category="Category3" Series="Series3" Value1="">
<Note Note="zero value for Series3 Category3" />
</StaticDataRow>
</Remark>
<Remark>
<StaticDataRow Category="Category1" Series="Series3" Value1="33">
<Note Note="zero value for Series3 Category1" />
</StaticDataRow>
</Remark>
<Remark>
<StaticDataRow Category="Category2" Series="Series3" Value1="">
<Note Note="zero value for Series3 Category2" />
</StaticDataRow>
</Remark>
<SortFilter SortColumn="Category,Series" />
<DataLayerLink ID="dllinked" />
<GroupFilter GroupColumn="Series" KeepGroupedRows="False" SortSequence="Ascending" />
</DataLayer>
<Series ChartXDataColumn="Category" ChartYDataColumn="Value1" LegendLabel="@Chart.Series~" StackGroupName="@Data.Category~" Type="Bar" ChartXDataColumnType="Text" BarStacking="Stacked">
<DataLayer ID="dl@Repeat.Series~" LinkedDataLayerID="dllinked" Type="Linked">
<CompareFilter CompareType="=" CompareValue="@Repeat.Series~" DataColumn="Series" ID="cfSeries" />
</DataLayer>
</Series>
<Remark>
<ChartXAxis AxisType="Category" ID="Axis@Repeat.Series~" />
</Remark>
</RepeatElements>
<ChartCanvasLegend />
</ChartCanvas>This is the strange result you get... and stranger yet, if you sort your data differently, the x-axis category names will change
But if you un-remark the blank value static data rows for each category, you achieve the expected results
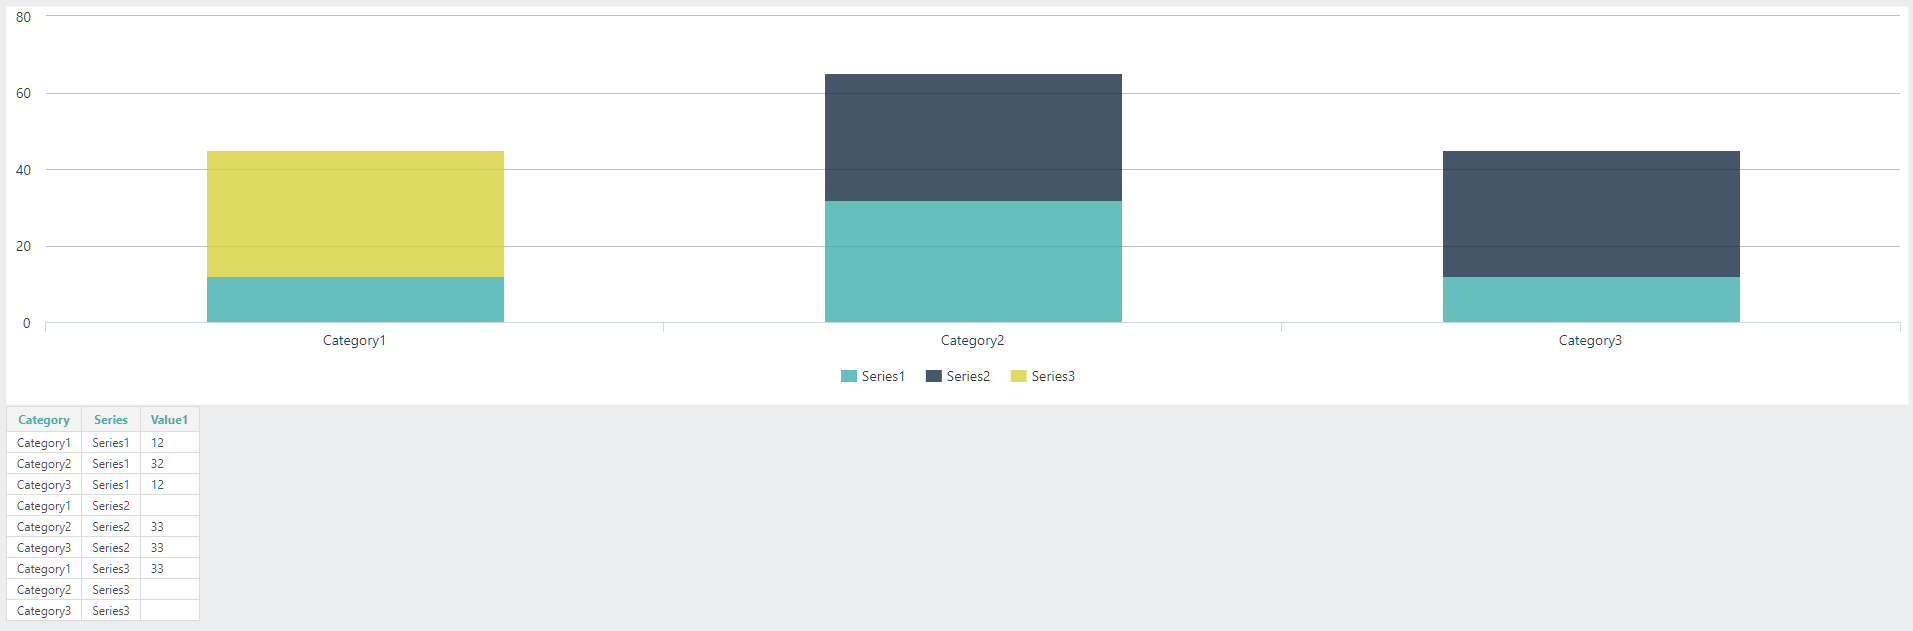
I believe the solution you will want to use is the Crosstab Filter.1 -
Sorry... I accidentally remarked out one of the values for Series 3 in my demonstration for the messed-up repeat element example.  Similar results hold true:

<ChartCanvas ID="cc1">
  <RepeatElements ID="rep">
    <DataLayer Type="Static">
      <StaticDataRow Category="Category1" Series="Series1" Value1="12" />
      <StaticDataRow Category="Category2" Series="Series1" Value1="32" />
      <StaticDataRow Category="Category3" Series="Series1" Value1="12" />
      <Remark>
        <StaticDataRow Category="Category1" Series="Series2" Value1="">
          <Note Note="zero value for Series2 Category1" />
        </StaticDataRow>
      </Remark>
      <StaticDataRow Category="Category2" Series="Series2" Value1="33" />
      <StaticDataRow Category="Category3" Series="Series2" Value1="33" />
      <Remark>
        <StaticDataRow Category="Category3" Series="Series3" Value1="">
          <Note Note="zero value for Series3 Category3" />
        </StaticDataRow>
      </Remark>
      <StaticDataRow Category="Category1" Series="Series3" Value1="33">
        <Note Note="zero value for Series3 Category1" />
      </StaticDataRow>
      <Remark>
        <StaticDataRow Category="Category2" Series="Series3" Value1="">
          <Note Note="zero value for Series3 Category2" />
        </StaticDataRow>
      </Remark>
      <SortFilter SortColumn="Category,Series" />
      <DataLayerLink ID="dllinked" />
      <GroupFilter GroupColumn="Series" KeepGroupedRows="False" SortSequence="Ascending" />
    </DataLayer>
    <Series ChartXDataColumn="Category" ChartYDataColumn="Value1" LegendLabel="@Chart.Series~" StackGroupName="@Data.Category~" Type="Bar" ChartXDataColumnType="Text" BarStacking="Stacked">
      <DataLayer ID="dl@Repeat.Series~" LinkedDataLayerID="dllinked" Type="Linked">
        <CompareFilter CompareType="=" CompareValue="@Repeat.Series~" DataColumn="Series" ID="cfSeries" />
      </DataLayer>
    </Series>
    <Remark>
      <ChartXAxis AxisType="Category" ID="Axis@Repeat.Series~" />
    </Remark>
  </RepeatElements>
  <ChartCanvasLegend />
</ChartCanvas>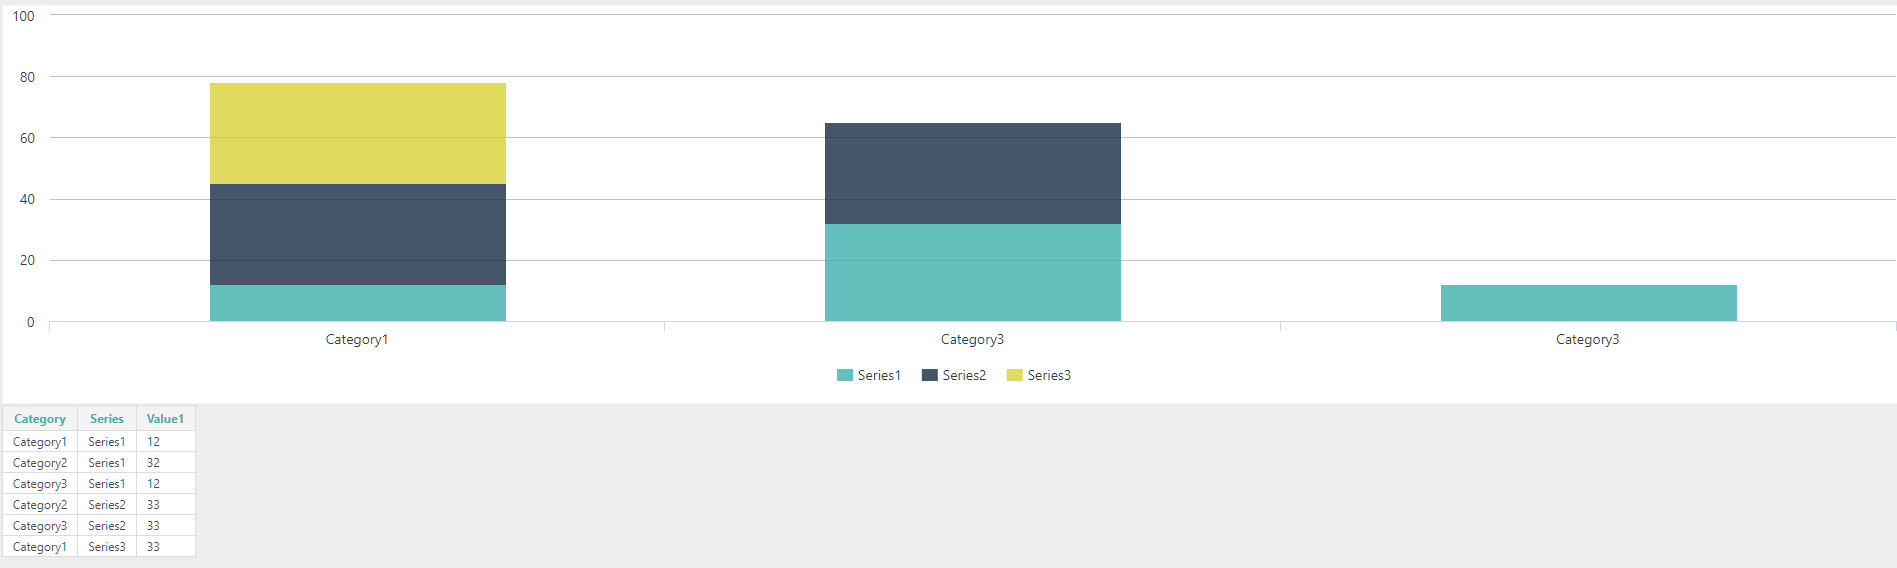
As you can see we end up with 2 X-axis categories named "Category3" and the actual stack values are incorrectly displayed. What is happening behind the scenes is Logi is starting in the left-most category position to display the first Category returned for that series.
This occurs even if we identify each Series to utilize the same X-Axis
<ChartCanvas ID="cc1">
  <RepeatElements ID="rep">
    <DataLayer Type="Static">
      <StaticDataRow Category="Category1" Series="Series1" Value1="12" />
      <StaticDataRow Category="Category2" Series="Series1" Value1="32" />
      <StaticDataRow Category="Category3" Series="Series1" Value1="12" />
      <Remark>
        <StaticDataRow Category="Category1" Series="Series2" Value1="">
          <Note Note="zero value for Series2 Category1" />
        </StaticDataRow>
      </Remark>
      <StaticDataRow Category="Category2" Series="Series2" Value1="33" />
      <StaticDataRow Category="Category3" Series="Series2" Value1="33" />
      <Remark>
        <StaticDataRow Category="Category3" Series="Series3" Value1="">
          <Note Note="zero value for Series3 Category3" />
        </StaticDataRow>
      </Remark>
      <StaticDataRow Category="Category1" Series="Series3" Value1="33">
        <Note Note="zero value for Series3 Category1" />
      </StaticDataRow>
      <Remark>
        <StaticDataRow Category="Category2" Series="Series3" Value1="">
          <Note Note="zero value for Series3 Category2" />
        </StaticDataRow>
      </Remark>
      <SortFilter SortColumn="Category,Series" />
      <DataLayerLink ID="dllinked" />
      <GroupFilter GroupColumn="Series" KeepGroupedRows="False" SortSequence="Ascending" />
    </DataLayer>
    <Series ChartXDataColumn="Category" ChartYDataColumn="Value1" LegendLabel="@Chart.Series~" StackGroupName="@Data.Category~" Type="Bar" ChartXDataColumnType="Text" BarStacking="Stacked" LinkedToXAxisID="XAxis1">
      <DataLayer ID="dl@Repeat.Series~" LinkedDataLayerID="dllinked" Type="Linked">
        <CompareFilter CompareType="=" CompareValue="@Repeat.Series~" DataColumn="Series" ID="cfSeries" />
      </DataLayer>
    </Series>
  </RepeatElements>
  <ChartCanvasLegend />
  <ChartXAxis AxisType="Category" ID="XAxis1" />
</ChartCanvas>
0 -
Hi Johnny & VISUI
This is great.Thank you both for your replies. I got so hung up on using a Repeat that I didn't think to transform the source data. It has worked a treat (and is fast too!).
Thanks again, Martin.
0
Please sign in to leave a comment.
Comments
5 comments