Using Group DrillThrough
Logi Info includes special "drill-through" features that allow you to view the detailed data that was used in the grouping operation, in an automatically-generated tabular report. Two elements, Group Drillthrough and its optional child, Drillthrough Column, produce the view. They may be used beneath these elements:
- Chart Canvas and many Series elements
- Crosstab Table Value Column
- Data Table Column
Let's start with the example we saw in Aggregating Grouped Data: grouped data, with unique rows and a group aggregate, summing the sales values. Our goal is to be able to review the individual values that went into the total for each group.

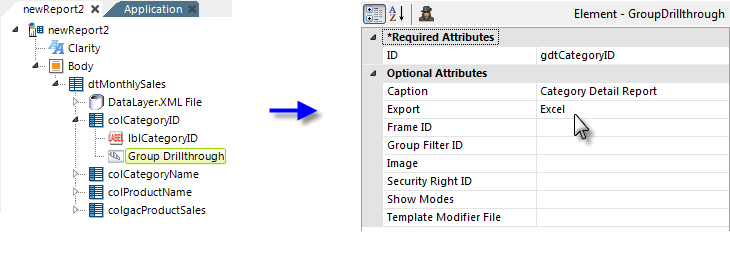
We'll add a Group Drillthrough element, as shown above, beneath the Data Table Column element for the column used to do the grouping (CategoryID). All of the element's attributes, other than ID, are optional but we'll set a custom caption for the detail report and an export button. More information about its attributes can be found in the Group Drillthrough element's Element
Reference page.

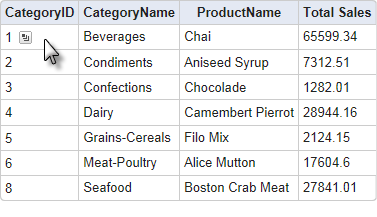
When the table is displayed and the cursor is hovered over the CategoryID column, a drillthrough icon will now appear, as shown above.

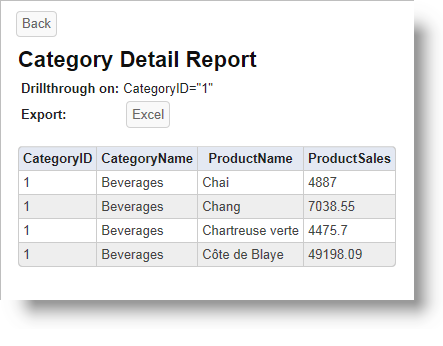
When the icon is clicked, the detail report shown above will be displayed. The report is generated automatically and you do not need to do anything other than include the Group Drillthrough element to get the standard report. However, the element's attributes do allow you to customize the icon image and report and, by including Drillthrough Column elements beneath it, you can set the number columns that will appear in the report and customize their appearance, too.