Retrieving Data Example: Using 3rd-Party APIs
Now let's look at a somewhat more complicated example that uses 3rd-party APIs (JQuery and Google) to draw three visualizations, using data from two Data definitions. The Data definitions are very similar, except one has more data points.

The Data definitions shown above are much like those we've seen earlier, except for two differences. The Json Data element's Json Style attribute is set to RowsToValueArrays and two Json Column elements are used.
By default, the Json Data element generates JSON data with the same column names as those output by the datalayer and all the JSON data types are strings. The Json Column element allows you to specify which columns will be included in the data, their variables names, and their data types. The Data Column attribute is the column name in the datalayer, the ID is column name in the JSON data, and the Data Type can be Number, String, or Date.

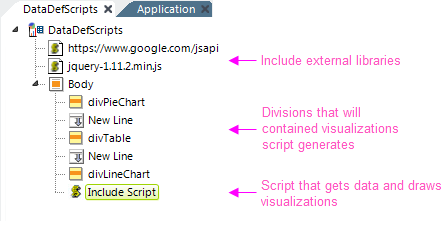
In our report definition, shown above, we've added two Include Script File elements to include the scripting libraries (one local, one external) we want to use. Empty Division elements, with real <DIV> tag output, are provided as the containers of the charts and Data Table we'll draw.
Finally, an Include Script element contains our JavaScript, which looks like this:
// load the Visualization API and the piechart package
google.load('visualization', '1', {'packages':['corechart']});
google.load("visualization", "1", {packages:["table"]});
// set a callback to run when the Google Visualization API is loaded
google.setOnLoadCallback(drawVisuals);
function drawVisuals() {
// get data from the first data definition
var jsonData = $.ajax({
url: "http://localhost/v12test/rdTemplate/rdData.aspx?rdData=GoogleChartLine",
dataType:"json",
async: false
}).responseJSON;
// create a table of the first data set
var data = new google.visualization.DataTable();
data.addColumn('number', 'Category ID');
data.addColumn('number', 'Freight Total');
// apply the data
data.addRows(jsonData.data);
// get datafrom a second data definition
var jsonData2 = $.ajax({
url: "http://localhost/v12test/rdTemplate/rdData.aspx?rdData=GoogleChartPie",
dataType:"json",
async: false
}).responseJSON;
// create a table of the second data set
var data2 = new google.visualization.DataTable();
data2.addColumn('string', 'Category ID');
data2.addColumn('number', 'Freight Total');
data2.addRows(jsonData2.data);
// instantiate and draw the Data Table, with some options
var table = new google.visualization.Table(document.getElementById('divTable'));
table.draw(data, {showRowNumber: false});
// instantiate and draw the line chart, using the same data as the table
var lineChart = new google.visualization.LineChart(document.getElementById('divLineChart'));
lineChart.draw(data, {width: 600, legend: 'bottom'});
// instantiate and draw the pie chart, with some options
var pieChart = new google.visualization.PieChart(document.getElementById('divPieChart'));
pieChart.draw(data2, {title: 'Another Fine Pie Chart', width: 400, height: 240, is3D: true});
}
The example shows you how to use the Data definition URL in code.

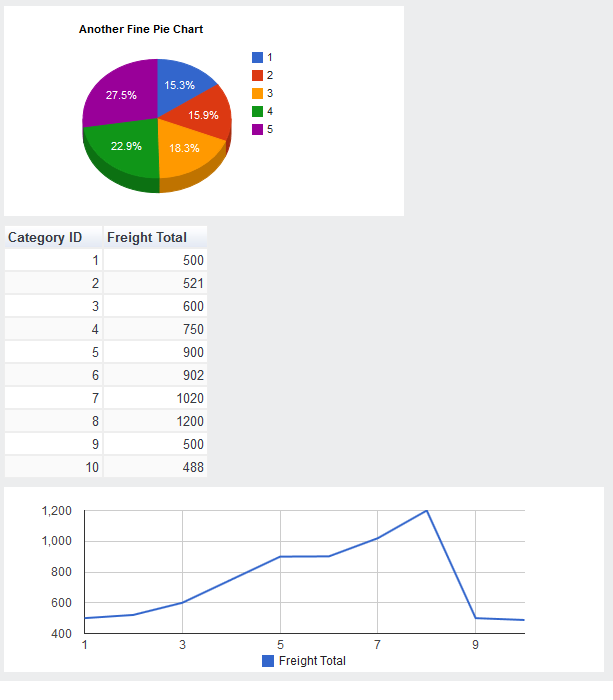
And the resulting output looks like the image shown above.
Though we've shown you these examples within Logi applications for convenience, you can use the same techniques with non-Logi applications or with HTML page data consumers. Just issue the URL for the Data definition to get the JSON data stream. And, of course, there are other techniques that can be used to retrieve and use the data.