Series.Bar - Using the Chart Drill To Element
The Chart Drill To element, a child of the Series element, enhances charts by allowing you to examine the data "behind" the chart.
![]() The parent Chart Canvas element must have an ID attribute value in order to use the Chart Drill To element with it.
The parent Chart Canvas element must have an ID attribute value in order to use the Chart Drill To element with it.
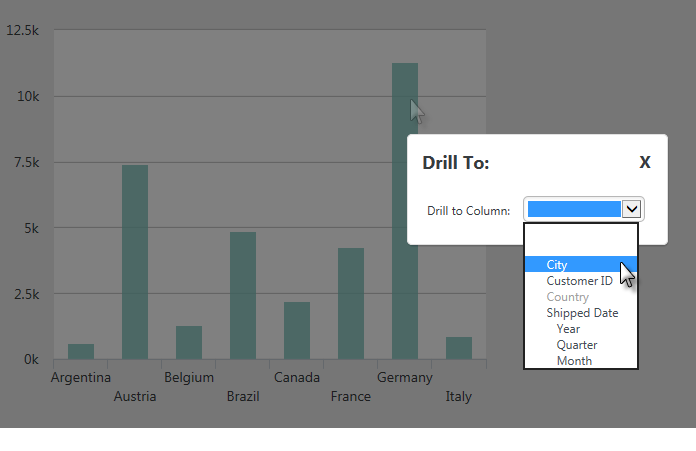
When the Drill To element is enabled, selecting a chart bar displays a list of columns, as shown below:

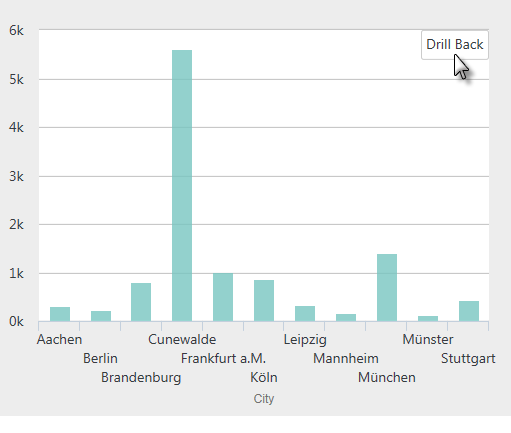
Selecting a column re-draws the chart so that only the data representing that specific bar is shown, and the X-axis changes to the selected Drill To column.
Select Drill Back to return the chart to it's previous state:

![]() Chart Canvas Charts that use the Chart Drill To element can only have a single Series.
The Drill Back button only appears when the mouse cursor is hovered over the upper right-hand corner of the chart.
Chart Canvas Charts that use the Chart Drill To element can only have a single Series.
The Drill Back button only appears when the mouse cursor is hovered over the upper right-hand corner of the chart.
Or, continue drilling further down into the data (assuming the elements are configured for it). For example, you could select the Munchen chart bar next and then select Customer ID to drill down to the customers in that city.
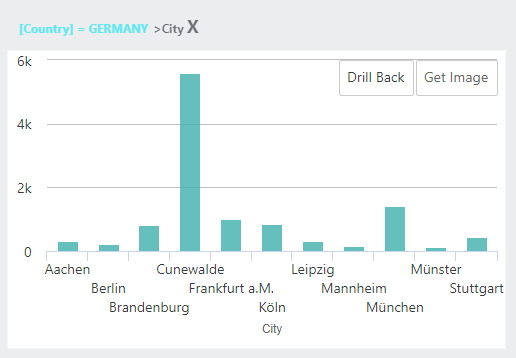
 New for 14.2 If your chart has been configured for it, as you drill further into the data, a breadcrumb trail becomes available. The breadcrumb trail can be used to access previously drilled levels, or clear the Drill To data altogether. To enable this feature, set the Show DrillTo Breadcrumb attribute to True.

As shown below, the Chart Drill To element drills into grouped data, so the datalayer used beneath the Chart Canvas Chart or Series element must be grouped using a Group Filter or Sql Group element. The example datalayer has been grouped on the ShipCountry column and the Keep Grouped Rows attribute was set to False. The Series itself has been configured so that its X-axis Data Column = ShipCountry and its Y-axis Data Column = gacFreight (the Group Aggregate Column that sums the Freight values).

Next, a Chart Drill To element was added beneath the Series element, shown below. Required child Drill To Column elements have also been added; they define the columns the user can select to drill into. They should be added and configured for columns that can be reasonably grouped, such as text-type columns with a limited number of unique values and date-type columns.

![]() You must also configure a Drill To Column element for the column that's specified as the chart's X-axis Data Column, in this example the ShipCountry column.
You must also configure a Drill To Column element for the column that's specified as the chart's X-axis Data Column, in this example the ShipCountry column.
The Column Header attribute specifies the text that will appear in the Drill to Column drop-down list options and will become the drilled chart's X-axis caption. The vertical order of the drop-down list options will match the vertical order of the Drill To Column elements in the definition. Year, Quarter, and Month options will be added automatically for Drill To Columns with Data Type = Date. You do not need to add any filter or additional grouping elements to achieve the results shown in the example above.
The Drill Back button displayed on the chart after drilling has occurred can be styled using the Drill Back Button Style element.