Analysis Grid - Zoom Control
Zoom control enables you to target specific data and zoom in for further analysis. If your application has been configured for it, you can now use zoom filtering on the following charts:
Bar
Line
Curved Line
Scatter Plot
For information on configuring this feature, see Analysis Grid Developers - Analysis Grid Attributes.
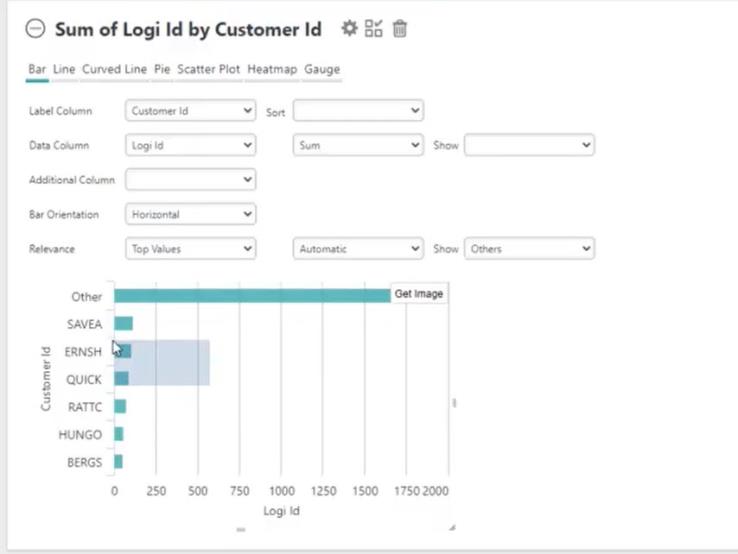
To utilize this feature, simply select the data you want to zoom in on, like below:

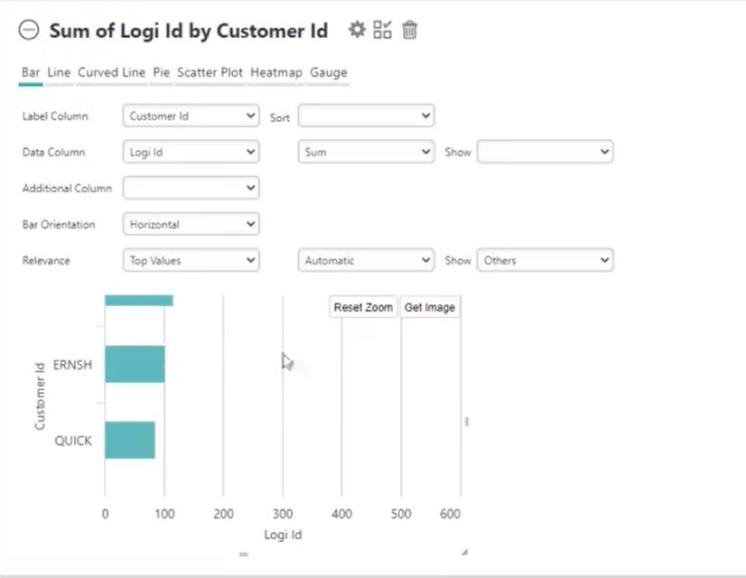
Upon releasing your cursor, Info will re-size the chart:

To remove the zoom and return the chart to its original state, select Reset Zoom.
Charts with zoom filtering can also be saved to the Dashboard for future analysis. For more information about Dashboards, see Dashboard for End Users.