Analysis Grid - Adding Analysis Grid Charts to Dashboards
The Analysis Grid includes an optional feature that lets you create a table or chart in one report, then
add that chart as a new panel in an existing Dashboard in another
report.

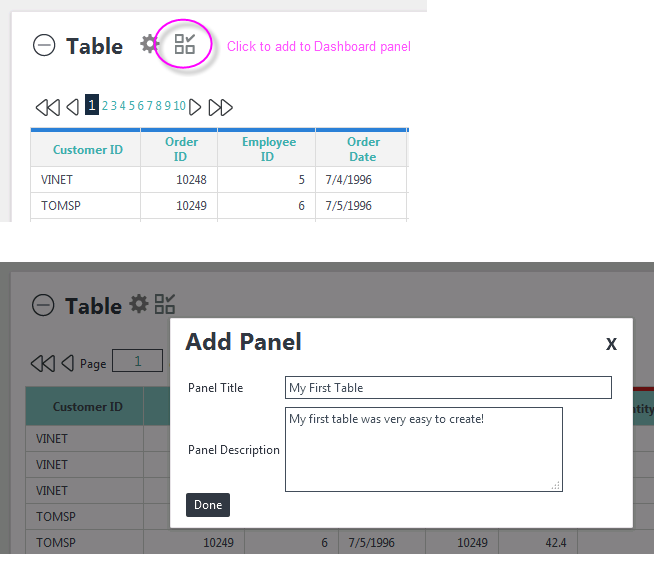
If your application has been configured for this feature, Analysis Grid tables and charts will display an Add To Dashboard link, as shown above. When you click the link you'll be prompted for the Panel Title and a description for display in the Dashboard Configuration Page.
The new table or chart panel thereafter appears in the Dashboard Configuration Page. You can insert multiple tables and charts into a Dashboard using this technique.
Charts with zoom filtering can also be saved to the Dashboard for future analysis.
For more information about Dashboards, see Dashboard for End Users.