The Analysis Filter
The Analysis Filter provides a mechanism that allows users to filter data at runtime and immediately updates visualizations dependent on that data.
The following topics introduce developers to the Analysis Filter super-element:
- Using the Analysis Filter Wizard
- Analysis Filter Attributes
- Analysis Filter Column Attributes
- Using the Analysis Filter Elements
- Saving Individual User Settings
- Filtering with Query String Parameters
- Using Analysis Filters in Dashboards
- Customizing Analysis Filter Appearance
About the Analysis Filter
The Analysis Filter allows users to apply filtering, at runtime, to the datalayers that support their visualizations. Changes made to the filtering immediately causes the visualizations to be updated.
As a super-element, the Analysis Filter has an interface that users can interact with at runtime. The interface can be configured and restricted depending on the use-case requirements.
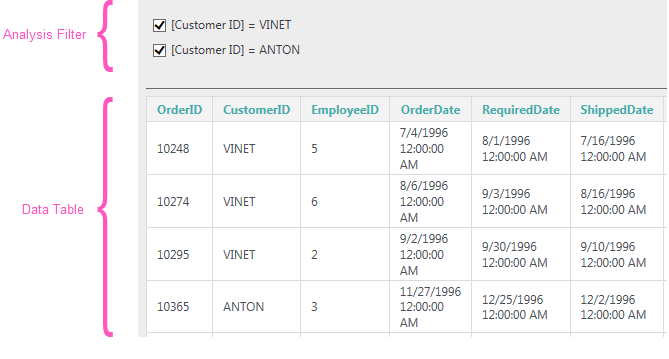
The example above shows the Analysis Filter in use with a Data Table. If the user checks or unchecks one of the filters, the Data Table will be refreshed accordingly (the refresh can include the entire page or just selected elements). The Analysis Filter has two developer-controlled viewing modes: Simple and Design.
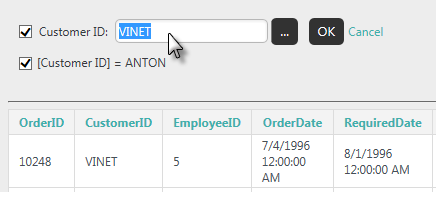
In Simple view, shown above, users can click an existing filter description to display input controls and change the filtering value.
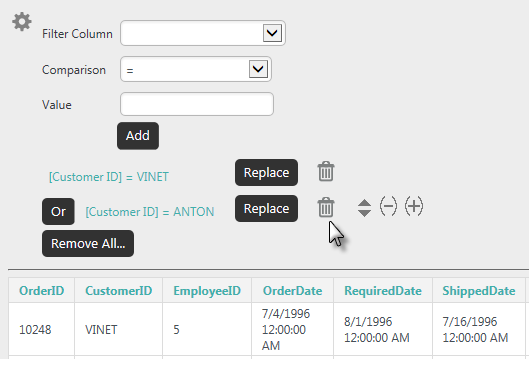
In Design view, a "gear" icon is displayed; clicking it opens a control panel, shown above, that can be used to manage filters.
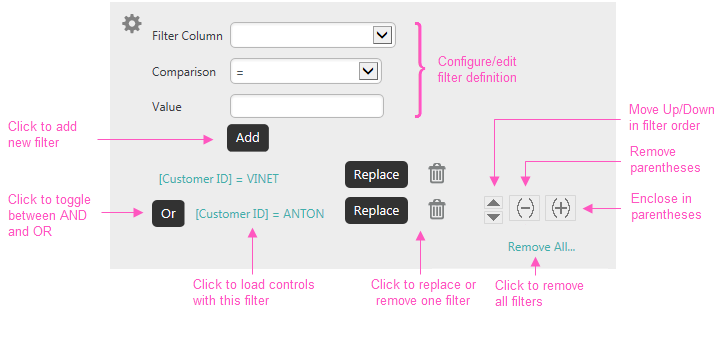
The controls provide a variety of tools for creating, editing, grouping, and removing filters, as shown above.
When using "In List" or "Not In List" comparisons in filters, multiple values can be entered, separated by commas. However, the values themselves may include commas, causing incorrect comparisons.
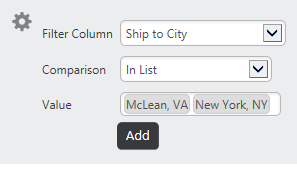
To address this, values for these types of filters are now represented in the controls by visual "pills" that enclose the complete value, as shown above. The filter uses the complete string within the pill during its comparison operation.
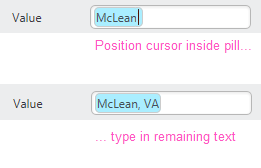
Pills with included commas are created by entering the first part of the value and pressing comma. This creates a blue pill as shown above. Then place your cursor inside the pill and type the rest of the value. Press tab to exit the pill and repeat the process for the next value, if desired.
The Analysis Filter is usually used to compare column data and a value you enter, but you can also directly compare the values in two data columns:
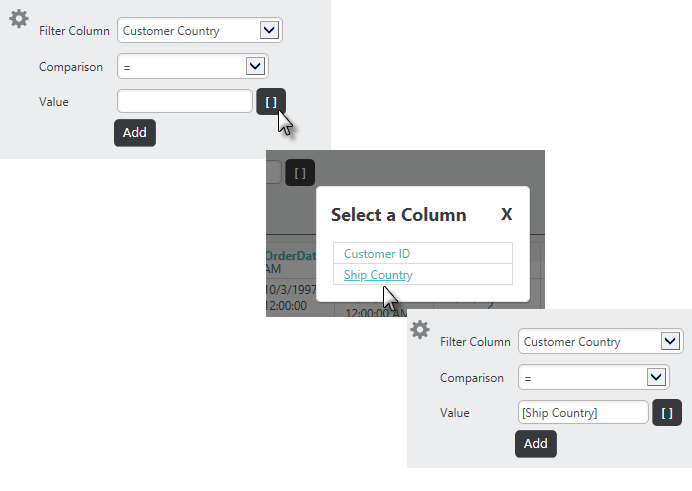
To do this, first select a Filter Column, as shown above, and a supported Comparison operator: =, <, <=, >, Not =, In List, Not In List, Starts With, Contains, Not Starts With, Not Contains, Like, Not Like.
Then select the second column from the list displayed when you click the [] button, or enter the column name within square brackets.
Retaining User Settings
Filters users create or modify can be saved between sessions and made available to them during their next session (this is discussed in more detail below).