Styling Your Report
In the last tutorial, we learned how to navigate through the Report List, how to select a report to view in the Report Viewer, and how to modify a previously created report in the Report Designer. Now that we have the skills to create intuitive reports with filters, we will learn how to utilize our filters in Report Viewer and stylize our reports to create our desired look and feel.
Filters in the Report Viewer
A Fresh Look at The Report Viewer
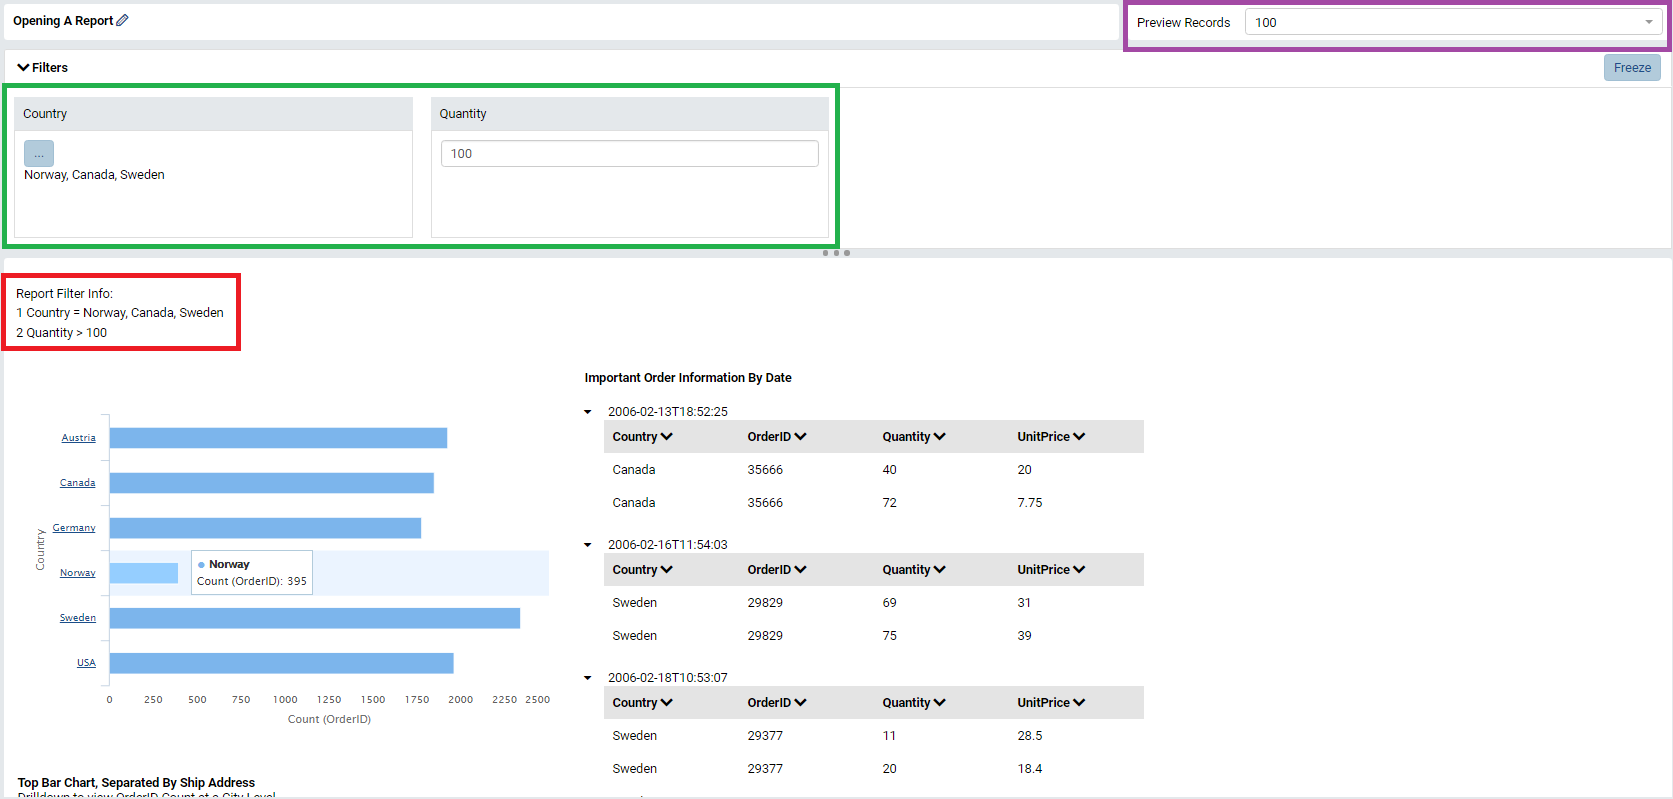
Recall that our previous tutorials, we saved our report as Opening A Report in the Tutorial category. Open this report in the Report Viewer. Immediately, we see that the filters we applied in the previous tutorial are now located in our Filters panel (highlighted in green) and a Report Filter Info text box is included at the top of the report (highlighted in red). Likewise, we see that our Preview Records has defaulted to 100, the value we set in the Report Designer (highlighted in purple).
Using Filters in the Report Viewer
To utilize filters in the Report Viewer, click on each filter box in the Filters Panel and edit their information. These filter boxes will act just the same as they were set in the Filter Properties in the Designer. Instead of Norway, Canada, and Sweden, let’s filter for Italy, Brazil, and Germany. Likewise, change our Quantity filter to find quantities greater than 500 and increase our Preview Records to 1000. Click the Update Result button at the top of the page to requery the data.
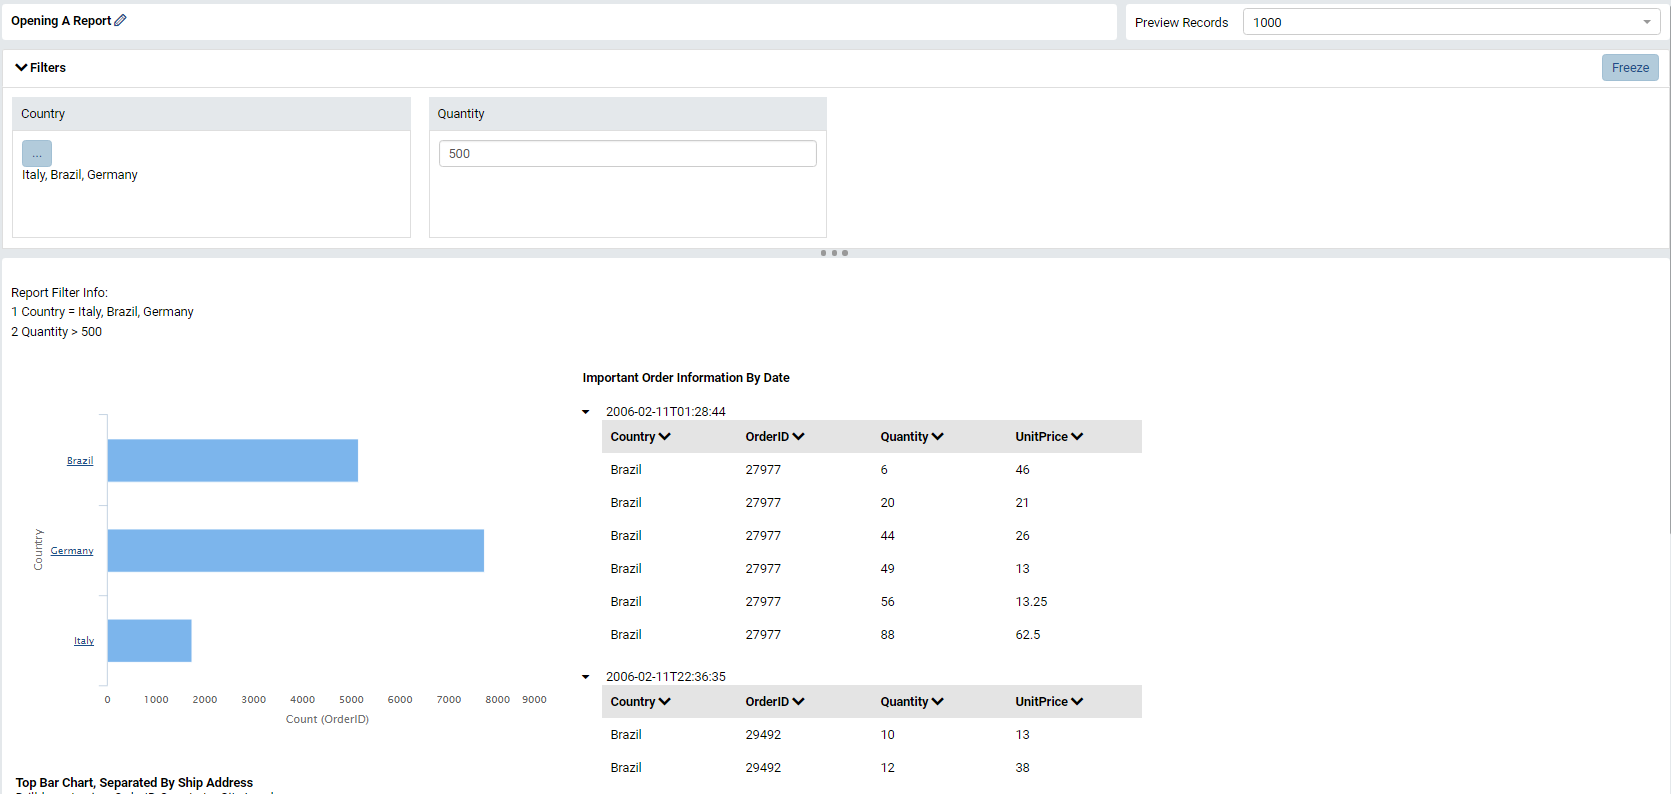
Notice in the Report Viewer we can change filter values but we cannot edit the Filter Logic. If we want to edit the underlying Filter Logic, we must move either to Quick Edit mode or to the Report Viewer.
Access Rights and Modifying the Report Definition
Recall the first tutorial where we set up Access Rights for Everyone to have Full Access to this report.

- Since we have the Full Access, we have access to the Report Designer and, therefore, our edited filters in the Report Viewer will save to the report definition.
- If we were to limit a user to View Only, they may edit the filters in the Report Viewer but the changes will not save to the report definition.
- If we were to limit a user to Save As access, they may edit the filters in the Report Viewer but their changes can only be saved to their own copy of the report.
- If we were to limit a user to Locked access, the report can be viewed as you created it in the Report Viewer but filter values cannot be changed.
- If we were to limit a user to Quick Edit access, the report can be modified and saved to the report definition from the Report Viewer or from Quick Edit mode.
Quick Edit: A Quicker Way to Edit Reports
Overview
Thus far, we’ve touched on the Report Viewer and Report Designer and their power to shape reports. The Report Viewer has the capability to give a user dynamically queried results but, since it’s purpose is to allow the user to view data, the user is extremely limited to the Edits they can make (namely, Filters). The Report Designer, on the other hand, gives users the power to define a report at its core which includes selecting data sources, modifying exporting options and access rights, and designing the body of your report. Quick Edit mode gives a user a middle ground between the two. In Quick Edit mode, a user can modify existing report parts and edit filters and filter logic but cannot modify data source, exporting options or access rights.
Quick Edit Mode
To enter Quick Edit mode, click on the Edit button in the Report Viewer and select Quick Edit. In this mode, we cannot add, remove, or copy report parts but we can certainly modify the ones we have!
Note
The following can be completed in the Report Designer but, for practice, we will complete it in Quick Edit Mode.
Let’s flip our Grid to Configuration Mode and add Product ID from the Order Details table to the table.
One major difference between Quick Edit mode and the Report Designer is the lack of a Data Source panel on the left-hand side. In order to add data sources, you must click on the + Button beside your desired field box (highlighted in red) and navigate the Pop Up GUI (highlighted in purple). This functionality is available in the Report Designer as well.

Modifying the Style of A Field
Now that we have a new field in our Grid, let’s modify the style of the ProductID column.
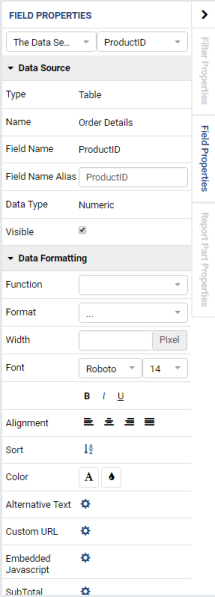
In the Grid’s Configuration Mode, navigate to the Field Properties Tab on the right-hand panel. Ensure that ProductID is selected in the Configuration Panel of the Grid by clicking on it (the name ProductID will appear as the Field Name in the Data Source section).
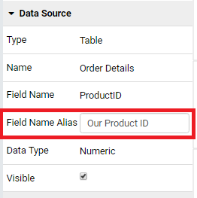
First, we want to change the title of the column to something more meaningful (or better formatted) than “ProductID.” In order to do this, locate the Field Name Aias in the Data Source Section and enter your desired name. For now, let’s name it “Our Product ID.” Once you click out of the Text Box, you’ll see the field name update in the Configuration Preview.
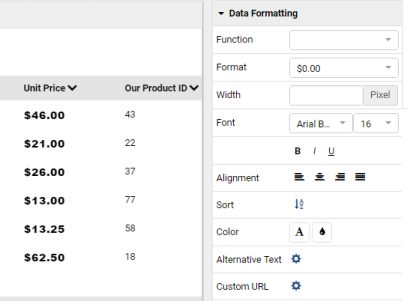
Let’s modify the Field Properties for the UnitPrice. First, rename it to “Unit Price.” Next, let’s to the Data Formatting section and modify the look of the column entirely.
We want to make our numbers appear as a monetary unit rather than a decimal and we want to change the font to Arial Black size 16. Simply utilize the Format and Font tools to make these changes.
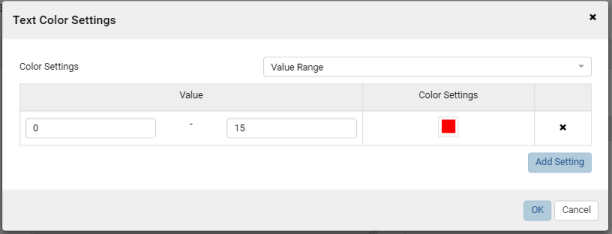
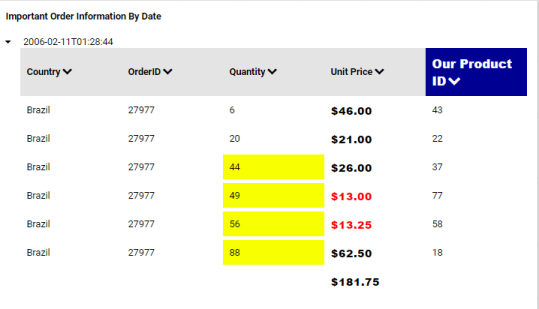
Next, we want to change the font of Unit Prices less than $15.00 to red. In the Data Formatting section, find the Color settings and click on the first button that has a graphic of the letter A (the Text Color Settings button) and a pop up menu will appear.

With Value Range selected in the drop down, click the Add Setting button. Now you will be able to add a range of values and assign a color to the range. We are going to assume that all unit prices are nonnegative so, for your range, you can simply put 0-15 and select a red color in the Color Settings column by clicking on the black square and using the Color Picker.
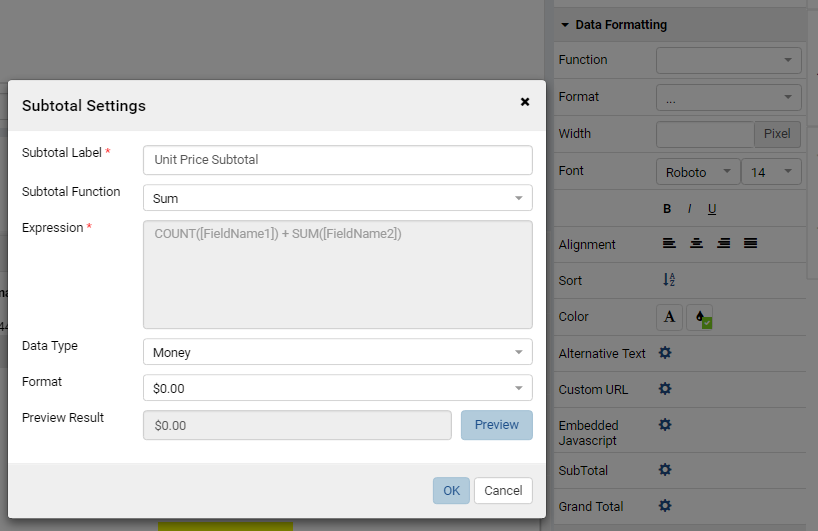
For each table in then grid, we want to add a Sub Total for Unit Prices. In the Data Formatting section, click on the Gear icon beside SubTotal and fill in the pop up menu with the following values.
Next, let’s highlight all numbers in the Quantity Column that are greater than 30. Select the Quantity field on your Configuration Panel. Navigate to the Data Formatting section on the Field Properties tab. In the Color settings, click the second button that has an ink drop graphic (the Cell Color Settings button) and a popup will appear. Repeat the process you used to set the text red earlier but assume that there’s an upper limit is 1,500 for quantity shipped.

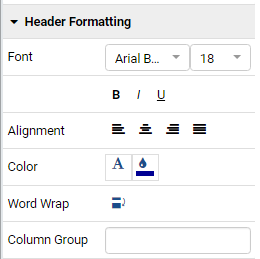
Let’s return to the field Our Product ID and modify the Header
Formatting in the Field Properties Tab. Using the skills you learned
in the Data Formatting section, change the font and font size (Arial
Black, 18 px), color (white), and background color (dark blue). Finally,
click the icon labeled Word Wrap in the Header Formatting section to
wrap the text to a new line when it’s larger than the column width.
When you’re complete, your Header Formatting section for Our Product ID
will look like this.
At this point, a table in our Grid should look like the following:
Modifying the Style of A Report Part
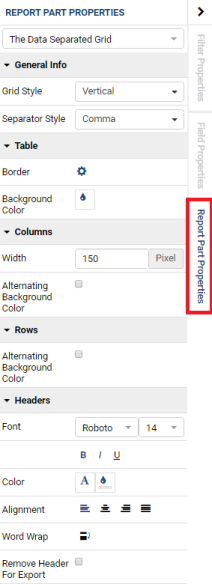
In addition to modifying styles of a particular field, our tool allows you modify Styles per Report Part. Any design decisions made at the Field level will override styles generated at the Report Part level.
To edit our Grid’s style at this level, click on our report part in
Preview Mode or click on the Report Part Properties tab on the far
right-hand side of the right panel.
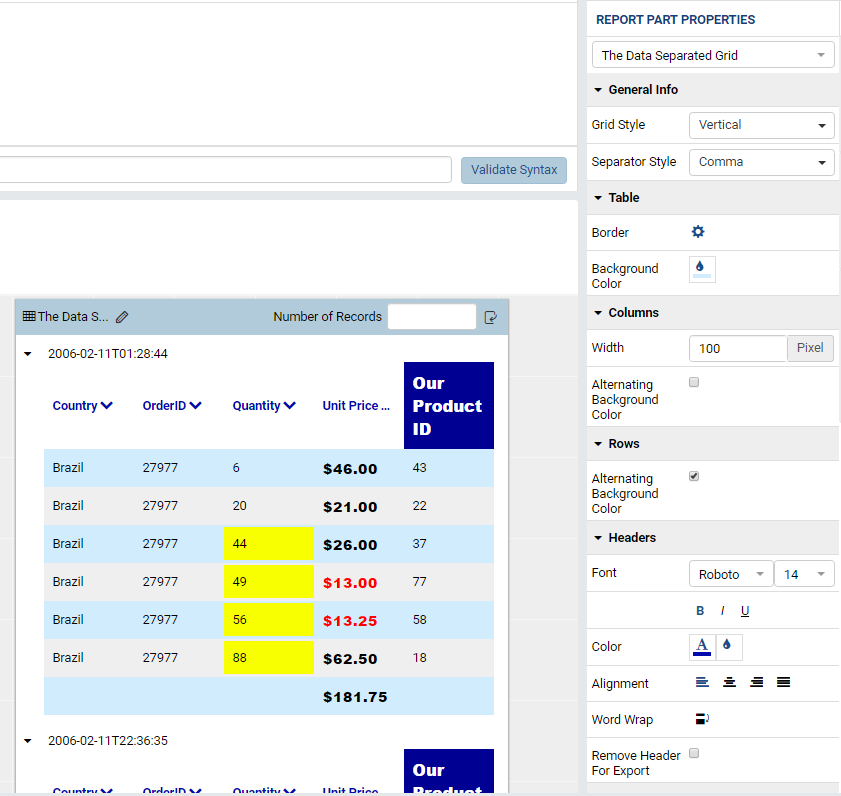
Here, let’s make the background color of the table a light blue, set the Column Width to 100, Alternate the background color for Rows, and change the Header’s text color to dark blue with a white background color. Once completed, your result should look similar to the following:
Further Report Style
On top of editing the style of a report part, we can modify the header and footer for a report in the Report Designer. Note: If you are currently in Quick Edit mode, move to the Report Designer.
Format
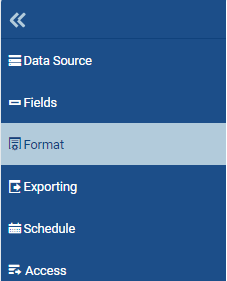
In the Report Designer, navigate to the Format tab on the blue panel
on the far left-hand side.
To enable the Report Header & Footer, check the box beside “Report Header & Footer” in the white Report Formatting panel on the left-hand side. Once enabled, you’ll be able to edit the header/footer in a similar fashion as your report body.
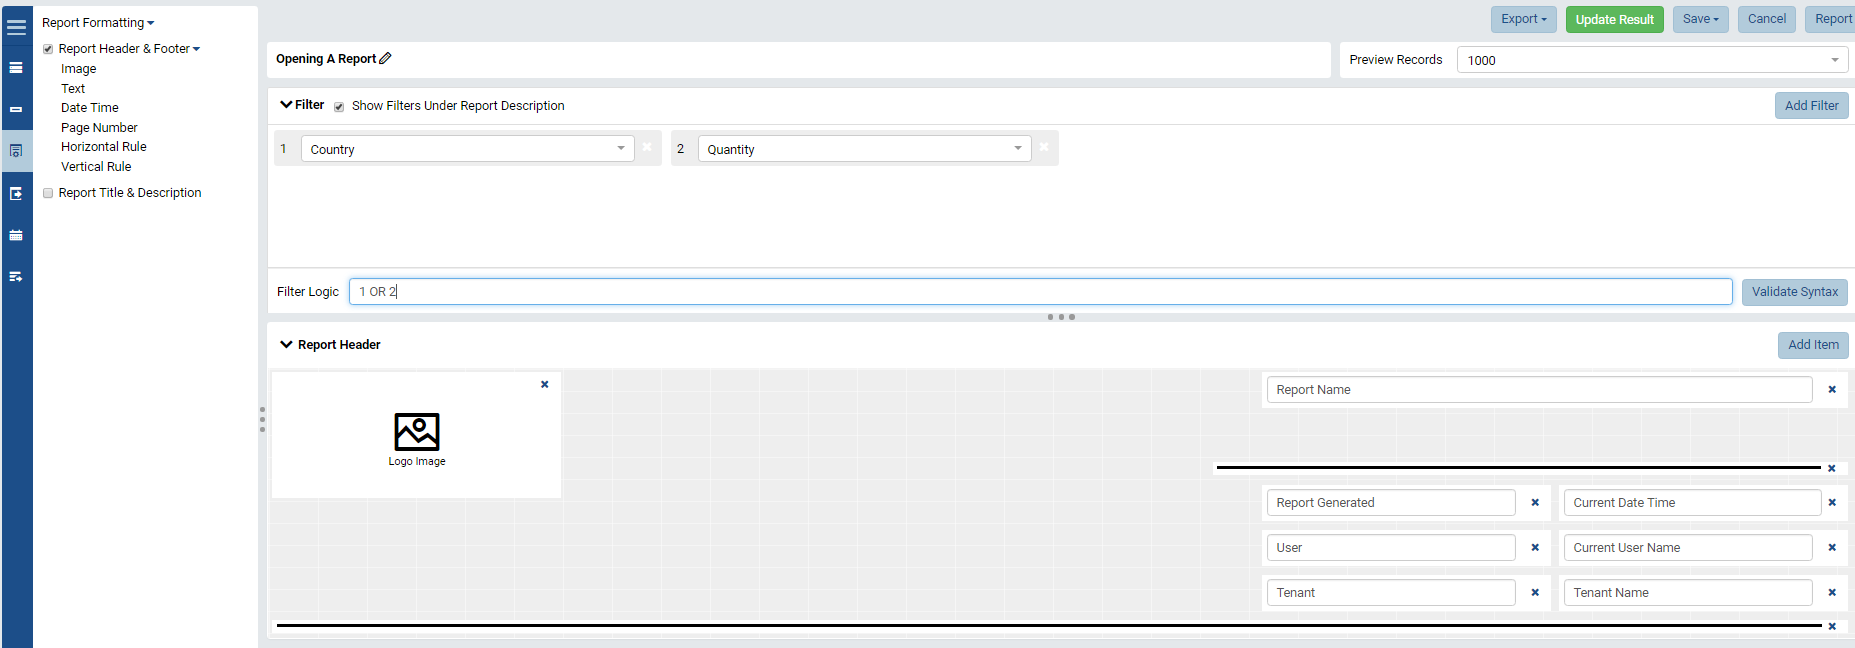
Several values are added to the header in a logical format but their order can be changed by simply dragging. Let’s try dragging the items around to generate a different layout.

To delete an item, simply click on the X in the item box. Let’s delete the Report Generated item.

To add an item, click on the Add Item button at the top of the Report Header Panel. Let’s add an image and place it below the User Item.

Modifying the Contents of a Format Item
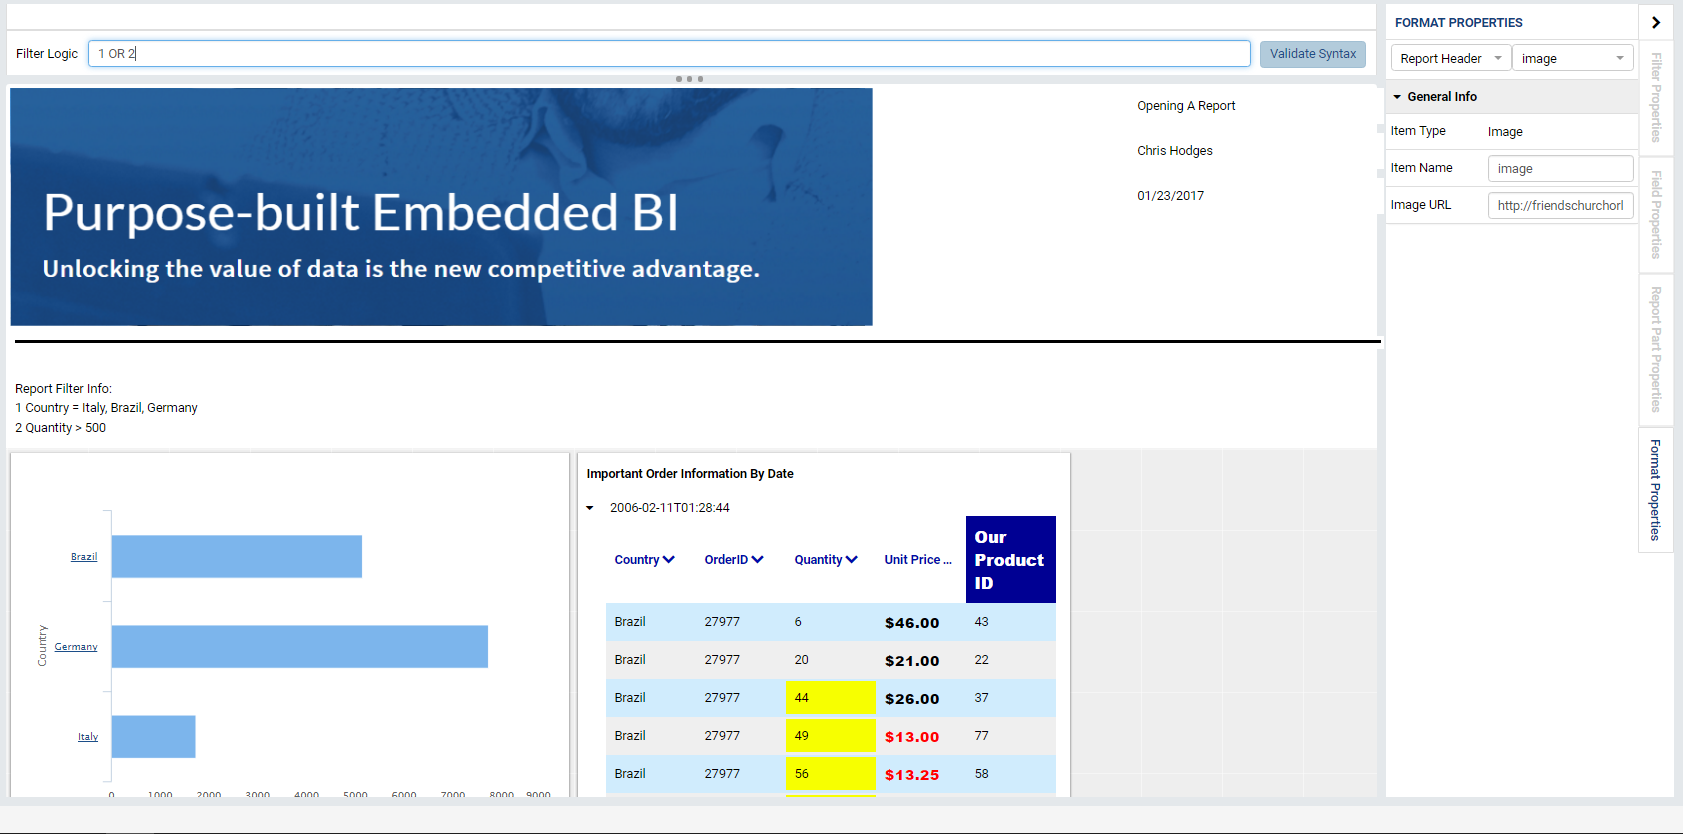
Once you’ve added the Report Header and Footer, a fourth tab, Format Properties appears on the Properties Panel on the far right-hand side. To edit the contents of a Format Item, click on the item in the header/footer and navigate to the Format Properties tab on the right-hand panel. Let’s add a URL in the General Info Section of the image we just added.
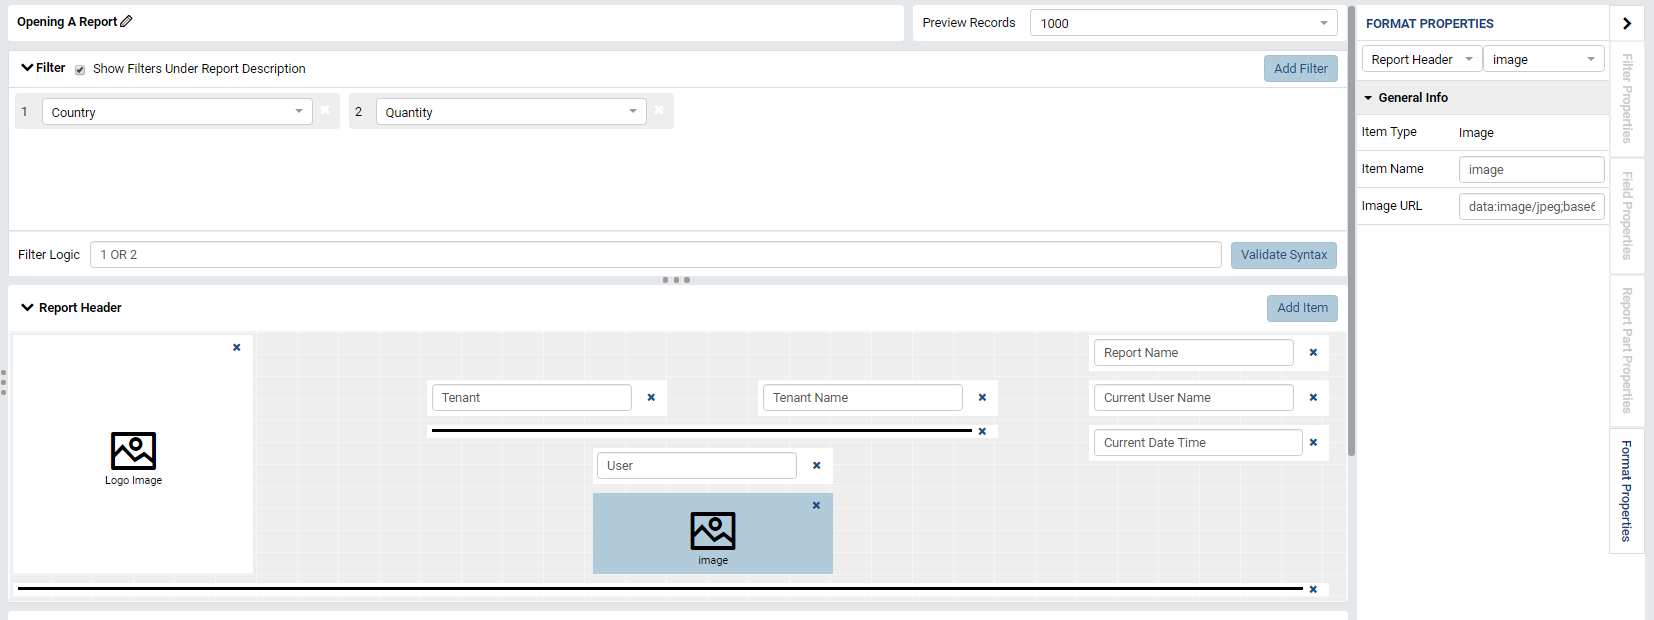
Once you’ve added the URL, we’ll notice that the image does not show up in the designer but rather the item’s name. By design, our tool displays Item Names rather than their values to allow for dynamic fields to be set when the report is viewed in the Report Viewer or Exported. Continue modifying your report header until you are satisfied with your result.
In the Report Designer:

In the Report Viewer:

A Cleaner Picture: Returning to Quick Edit
Once you’ve created your desired layout, you can return to Quick Edit mode to edit the contents of each item in the header/footer. While this functionality is available in the Report Designer, Quick Edit mode displays each item’s contents rather than their names.
