Thinkspace - Zoom Mode: Zooming and Panning
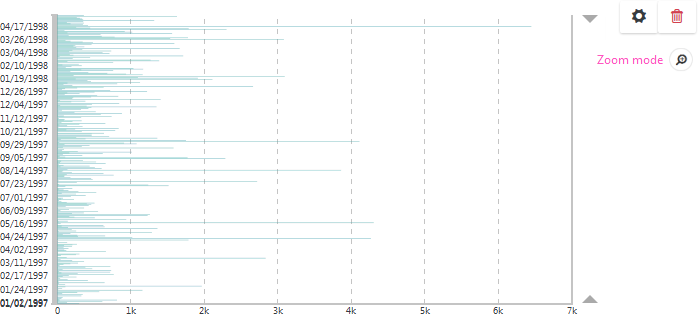
Charts may include so much data that it's useful to be able to "zoom" into them. The Thinkspace includes a zooming and panning feature that lets you do just that. Consider this bar chart:

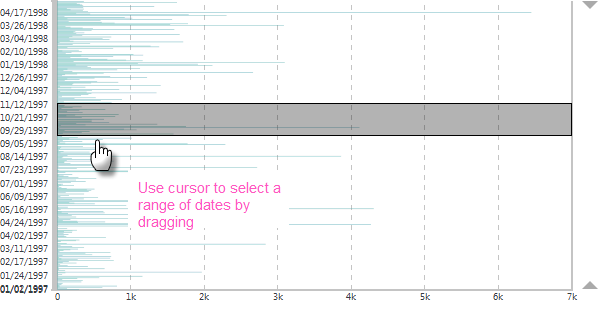
Interesting, but suppose you want to look more closely at a specific range of dates?

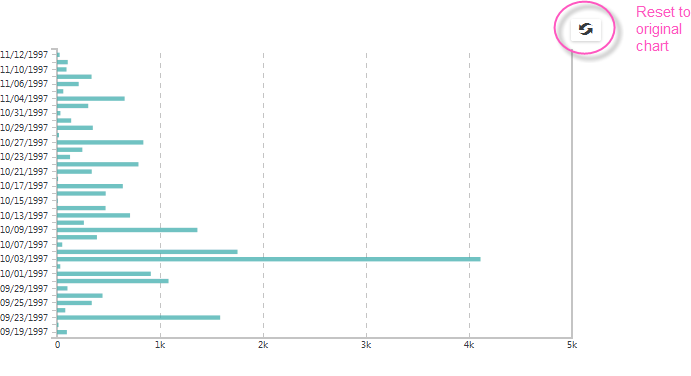
You can zoom "into" the chart by dragging a selection area around certain dates, as shown above. Depending on the chart type and data, you may be dragging the selection area vertically, as above, or horizontally, or both. When you release your mouse button, the chart will be re-drawn to include just the selected data.

After the chart zooms in on your selected data area, a Reset icon will appear, as shown above. Click it to reset the chart to its original state.

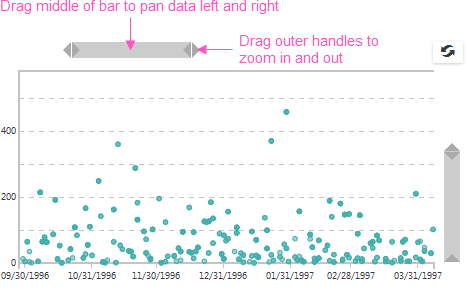
Depending on the chart type and data, you'll also see a vertical and/or horizontal "pan-zoom" bar outside the chart, adjacent to where your selection area was. The example Scatter chart above has both. Drag the bar's outer handles to zoom in and out, and drag in the middle of the bar to pan the chart canvas through the data.